Tracking features through time and scale
A Morse–Smale complex describes one field at one moment. When the field changes,
because it is a frame of animation, a simulation step, or the same image blurred a little more,
you usually want to know which peak now is which peak then. FeatureTracker answers that. It
matches each moment's features to the last moment's, so every feature gets a track: a stable id,
a path, the moment it was born and the moment it died.
This example moves six hills along circular paths for 90 frames, computes the complex of every frame, and follows its maxima. Each track is drawn in its own colour, ending in a dot where the hill is now:
import afield.geometry.topology.morsesmale.*
import afield.geometry.topology.tracking.*

// Six hills circling at different speeds, sampled for 90 frames. Each frame's maxima are matched to
// the last frame's, so each hill keeps one track for as long as it stays distinct.
val hills = (0 until 6).map { i -> Triple(0.4 + 0.25 * i, 30.0 + 9.0 * i, 1.0 - 0.1 * i) }
fun field(t: Double) =
    Img.generate(200, 150) { x, y ->
        hills
            .withIndex()
            .sumOf { (i, h) ->
                val (speed, radius, amplitude) = h
                val cx = 100 + radius * cos(speed * t + i)
                val cy = 75 + radius * 0.7 * sin(speed * t * 1.3 + i)
                amplitude * exp(-((x - cx).pow(2) + (y - cy).pow(2)) / 120.0)
            }
            .toFloat()
    }

val tracker = FeatureTracker(MatchingWeights(birthDistance = 10.0, maxDistance = 20.0))
for (frame in 0 until 90) {
    val ms = MorseSmale.compute(field(frame / 40.0), persistence = 0.05)
    tracker.add(frame.toDouble(), ms.features(minPersistence = 0.05, types = setOf(CriticalType.MAXIMUM)))
}

val last = field(89 / 40.0).normalized().colormap("viridis")
showImgGrid(
    "${tracker.tracks.size} tracks over 90 frames" to
        last.drawFLines(tracker.toFLines(thickness = 2.0) + tracker.aliveFLine(9.0), scale = 3.0),
    columns = 1,
    cellSide = 600,
)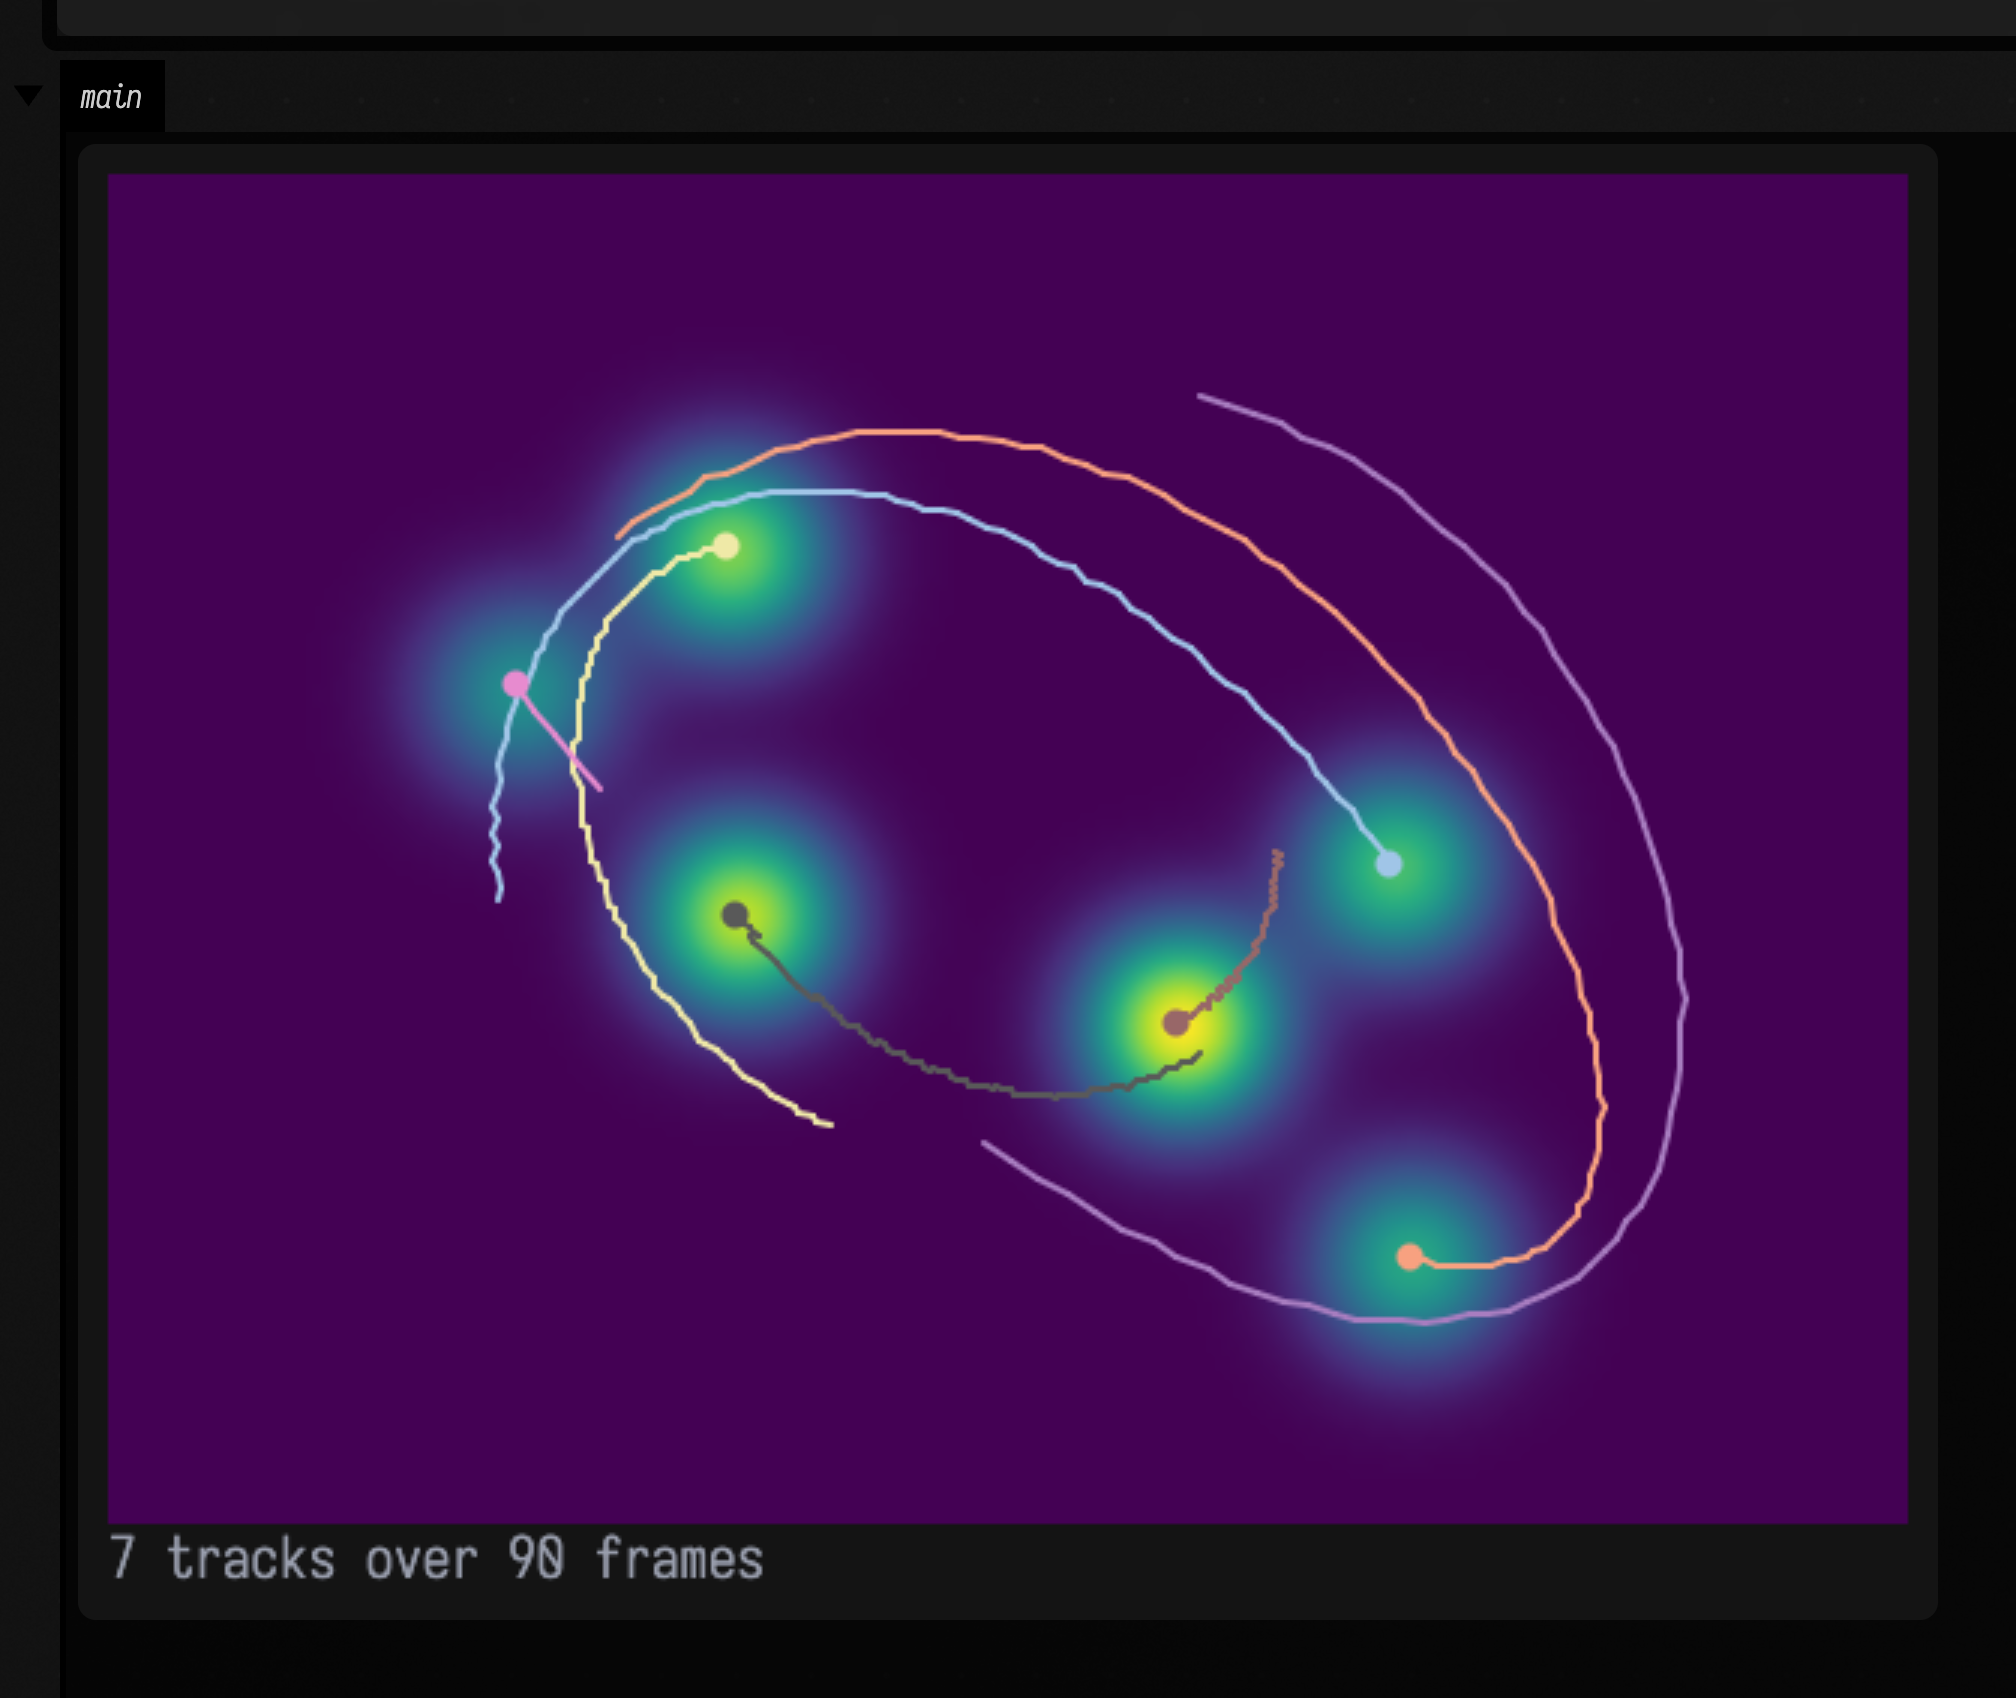
Six hills give seven tracks: one track ended when its hill passed close to another, and a new one started when they parted. In this example the overlap produces a single peak, so the tracker records the merge and the later split.
Needs the Morse–Smale library
The examples compute Morse–Smale complexes, which need the optional library: see the welcome page's Geometry extensions panel. The tracker itself is plain Kotlin and works on features from anywhere.
How features are matched
FeatureTracker.add(time, features) matches the new features to the previous ones at the least
total cost, by the Hungarian method (Field's HungarianAssignment, the same solver behind
assignment and flow matching). The costs come from MatchingWeights:
- matching two features of the same type costs their squared distance, plus
valueWeighttimes the squared change in value and persistence; - leaving a feature unmatched costs
birthDistancesquared plusvalueWeighttimes half its squared persistence. That is the price of letting it die or be born, so a faint feature dies easily and a strong one does not; - features further apart than
maxDistanceare never matched, and minima never match maxima.
The persistence terms are the lifted Wasserstein distance between persistence diagrams that Soler, Plainchault, Conche and Tierny introduced for tracking topological features (2018).
When things move further between moments than these distances allow, pass a motion estimate:
tracker.add(time, features) { x, y -> dx to dy } moves each previous feature by your prediction
before matching. Optical flow, the particles of a particle video or a
simulation's velocity field can all supply it.
The tracks are ordinary data: tracker.tracks, each with its samples over time; born and died
after each add; toFLines() and aliveFLine() for drawing; and network() for the tracks as a
GeometryNetwork, optionally in three dimensions with time as z.
Through scale
The same matching works across scale instead of time. ScaleSpace.track blurs an image at a list of
increasing σ, computes the complex at each, and tracks the extrema from each σ to the next. A feature
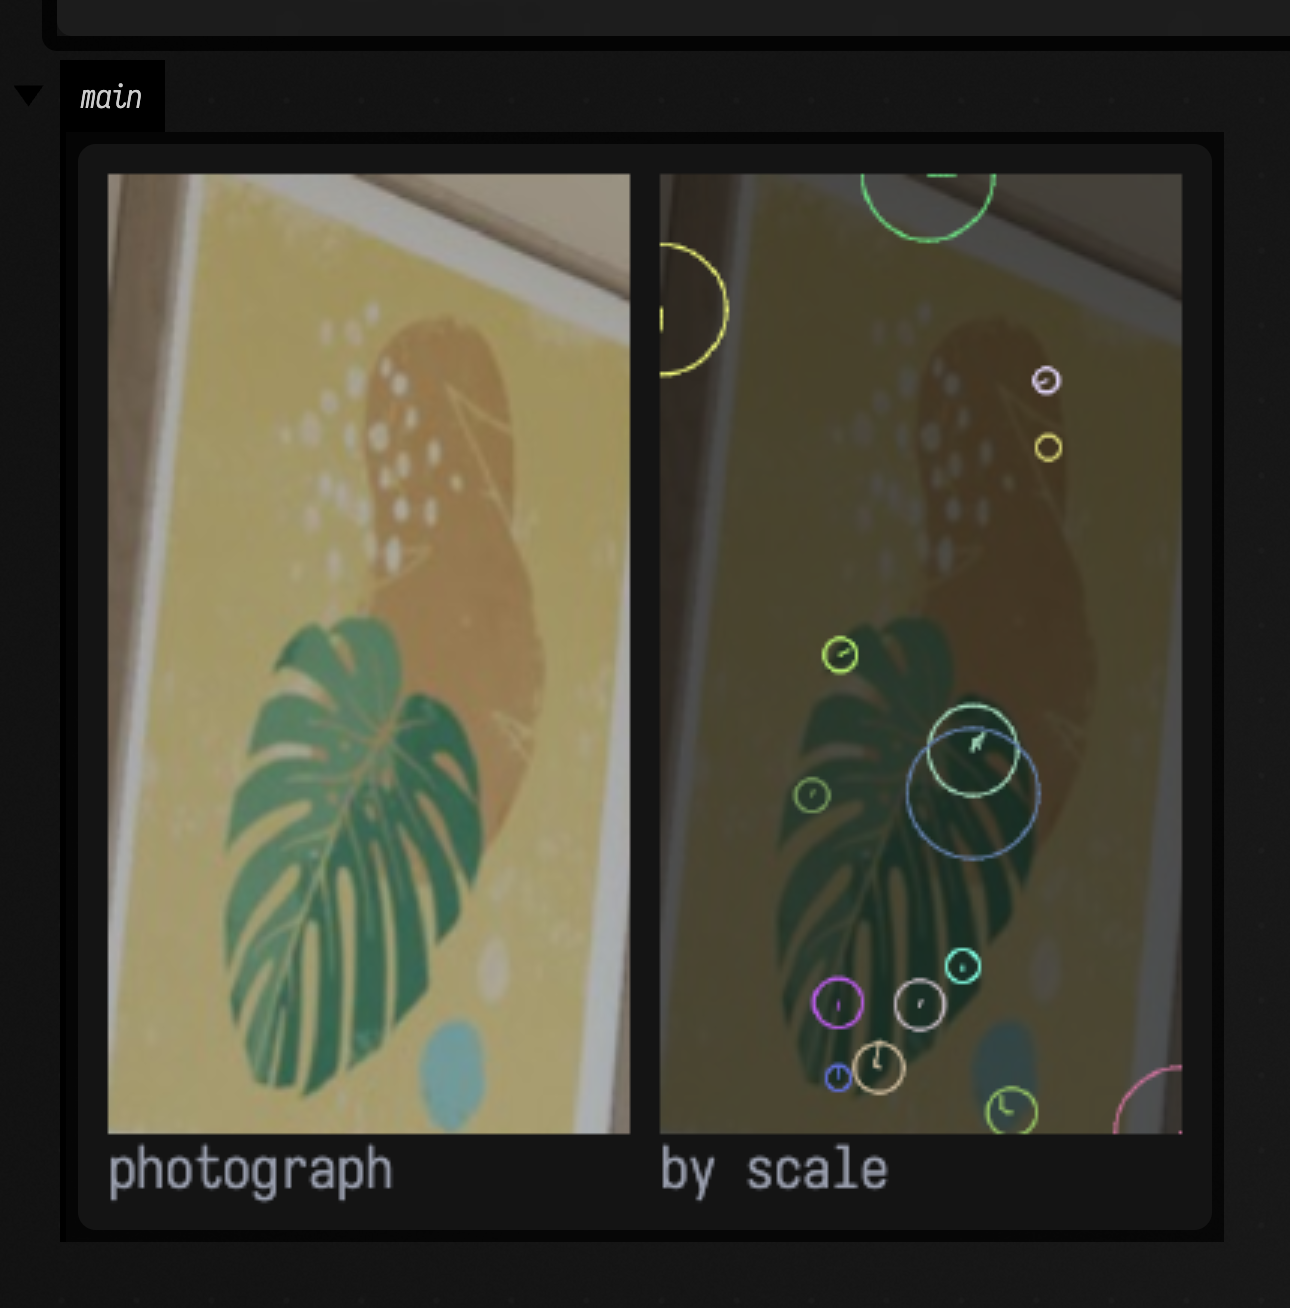
that survives a large blur is large. One that dies at the first blur is fine detail. This example
tracks the dark places in the leaf print and draws each one that survives to σ 3 or more as a circle
twice the largest σ it reached:
import afield.geometry.topology.morsesmale.*
import afield.geometry.topology.tracking.*

// The leaf print's dark spots (minima of its brightness), followed as the image is blurred more and
// more. A feature that survives a large blur is large; one that dies at the first is fine detail.
val print = imgFromFile("public/docs/assets/vision/fline-viewer.jpg", 3).crop(78, 262, 128, 236).scaleBy(2.0)
val sigmas = [1.0, 2.0, 3.0, 4.0, 6.0, 8.0, 11.0, 16.0]
val space =
    ScaleSpace.track(print.luma(), sigmas, persistence = 0.02, maxDistance = 14.0, types = setOf(CriticalType.MINIMUM))

// Each feature that survives to σ 3 or more, as a circle where it starts with radius twice the largest
// σ it reached (the displayed diameter is four times σ), and its path through scale.
val lasting = space.tracker.tracks.filter { space.scaleOf(it) >= 3.0 }
val circles = lasting.map { t ->
    val (x, y) = t.samples.first().second.let { it.x to it.y }
    FLine().circle(x, y, 2 * space.scaleOf(t)).also {
        it.color = FeatureTracker.colourOf(t.id)
        it.thickness = 1.5
    }
}
val tracks = lasting.map { track ->
    track.toFLine().apply {
        color = FeatureTracker.colourOf(track.id)
        thickness = 1.5
    }
}
val dark = Img(print.width, print.height, 3, FloatArray(print.width * print.height * 3))
showImgGrid(
    "photograph" to print,
    "by scale" to print.overlay(dark, 0.55).drawFLines(circles + tracks),
    columns = 2,
    cellSide = 320,
)
Comparing fields by their topology
persistenceDiagramDistance(a, b) measures how different two persistence diagrams are: the least
total cost of moving one diagram's (birth, death) pairs onto the other's, or onto the diagonal where
pairs vanish (the p-Wasserstein distance, p = 2 by default). Two fields with the same peaks and
pits in the same places at the same heights score 0; small changes in shape score little. It is
solved exactly by default; with epsilon it uses the entropic Sinkhorn solver, which handles the
tens of thousands of pairs a noisy image has.
import afield.geometry.topology.morsesmale.*
import afield.geometry.topology.tracking.*

// Three hills, the same hills nudged a few pixels, and a different set of five.
fun hills(centres: List<Pair<Double, Double>>) =
    Img.generate(160, 120) { x, y ->
        centres.sumOf { (cx, cy) -> exp(-((x - cx).pow(2) + (y - cy).pow(2)) / 150.0) }.toFloat()
    }
val frameA = hills([40.0 to 40.0, 100.0 to 60.0, 70.0 to 95.0])
val frameB = hills([43.0 to 41.0, 98.0 to 63.0, 72.0 to 92.0])
val frameC = hills([30.0 to 30.0, 60.0 to 30.0, 120.0 to 40.0, 50.0 to 90.0, 110.0 to 95.0])

fun diagram(f: Img) = MorseSmale.compute(f, persistence = 0.02).persistenceDiagram(dimension = 1)
val a = diagram(frameA)
val rows = ["A, the same field" to a, "B, hills moved" to diagram(frameB), "C, a different field" to diagram(frameC)]
markdown(
    "distances",
    buildString {
        appendLine("| A against | pairs | exact | entropic (ε = 1e-4) |")
        appendLine("| --- | --- | --- | --- |")
        for ((label, d) in rows) {
            appendLine(
                "| $label | ${d.size} | ${persistenceDiagramDistance(a, d).f4} | ${persistenceDiagramDistance(a, d, epsilon = 1e-4).f4} |",
            )
        }
    },
)
showImgGrid(
    "A" to frameA.normalized().colormap("viridis"),
    "B" to frameB.normalized().colormap("viridis"),
    "C" to frameC.normalized().colormap("viridis"),
    columns = 3,
    cellSide = 200,
)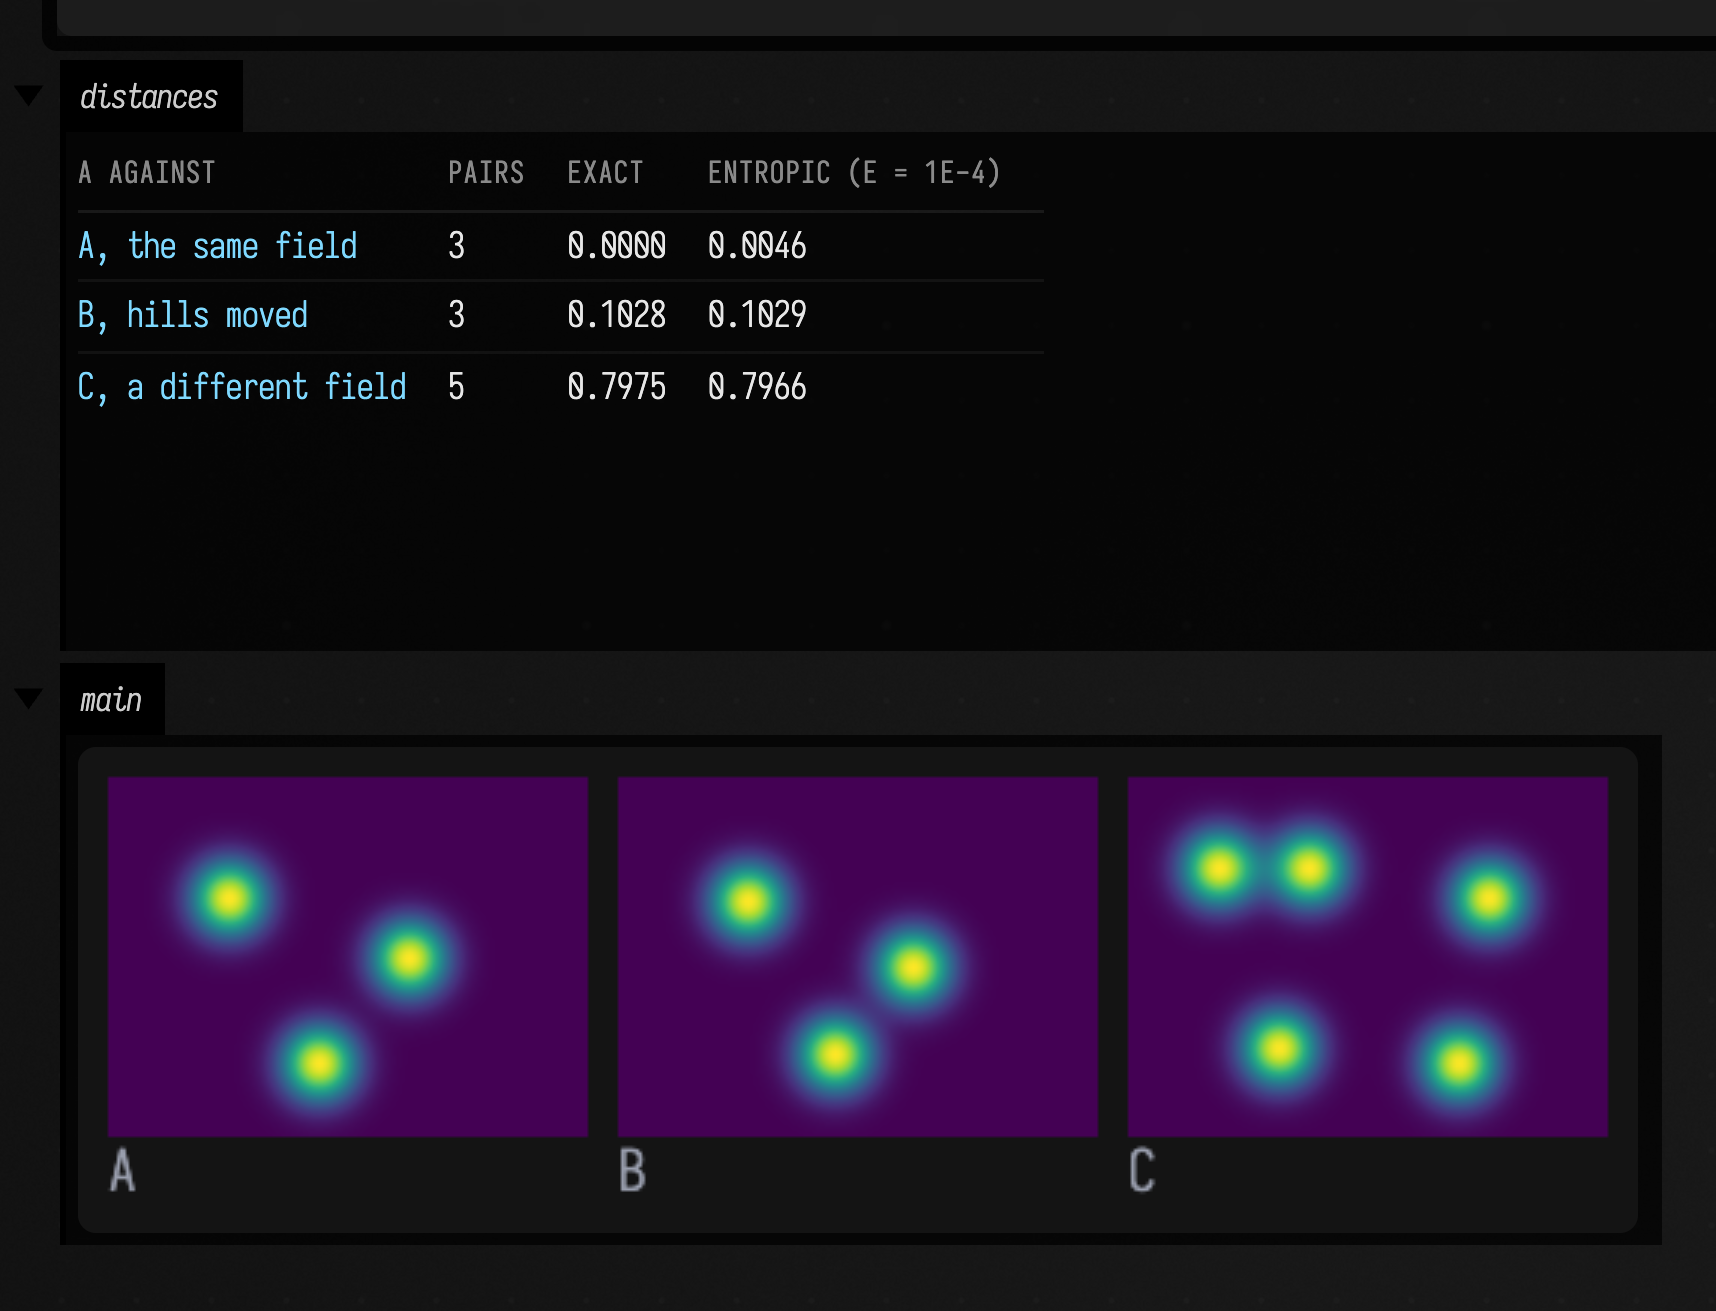
The moved hills score about a tenth of the different field. The entropic solver lands within a few thousandths of the exact distance, which is also why it gives A against itself a small positive number rather than 0.
Real footage
Tracking the extrema of brightness or colour in filmed footage is harder than in a field you
compute. On cloth, wings or skin, the brightest point moves between features from frame to frame,
and features split and merge as the material deforms. With footage, use the motion argument with
a dense motion estimate, and expect tracks that last for parts of a shot rather than all of it.
How this is checked
FeatureTrackingTest checks the matching (a moved feature is matched, a new one is born,
minima never match maxima, the distance gate holds, a faint feature dies rather than jumps), the
tracker's identities and events, motion prediction bridging jumps longer than the gate, a
drifting Gaussian followed for all 30 frames, two merging hills leaving the stronger one as the
survivor, a large blob outlasting a small one in scale space, and the diagram distance on a hand
computed case, with the entropic solver within 1% of the exact distance at small epsilon. Three
real clips were tried for the footage section: the 1896 serpentine dance from the particle-video
page, a veil dance and a high-speed butterfly. None gave tracks worth showing without dense
motion guidance, which is why that section is advice rather than a figure.