Logging: channels, sinks and the console
Field talks a lot. Boot narrates itself, the renderer reports a frame rate, the Kotlin compiler reports how long it took, the file watcher says what changed. All of it goes through one small layer, and once you know the layer you can send that output somewhere new, pull one subsystem's chatter out of the noise, or stop a channel from filling your terminal without losing it anywhere else.
There is one function to know:
lprintln("info,mypage", "something happened")"info,mypage" is a channel: a comma-separated list of tags that consumers use to select
messages. There
are 1105 places in src/jvmMain that call
lprintln with the channel written out as a literal, spelling
256 distinct channel strings between them.
By convention the first tag is a severity, drawn from six the console knows how to colour
(PinnedConsole.kt:1024),
and the tags after it say where the line came from. Only the colouring depends on that
convention; nothing enforces it, nothing parses a hierarchy, and "error,disk,retry" is
three flat tags rather than a path.
The dispatcher and its sinks
lprintln builds a LogEvent and hands it to LogDispatcher, which forwards it to every
registered LogSink (logger.kt:18). The
sink list starts with just the terminal
(Logging.kt:38)
and is open at runtime: addSink, removeSink, setSinks, and withSink, which brackets an
add/remove pair so an early return cannot leak one. A sink is a fun interface
with one method, so a lambda is a sink.
Seven of them exist in the tree: StdoutLog,
PinnedConsoleSink, LogStream, NotifyLog (which also raises a desktop notification),
SilentLog, a CLI sink and TputLog. This box adds its own for the length of a block, and
shows what it received:
:::static
import afield.ai.diagnostics.LogDispatcher
import afield.ai.diagnostics.LogEvent
import afield.ai.diagnostics.LogSink
import afield.ai.diagnostics.withSink
import afield.app.diagnostics.logging.lprintln

// A sink is a fun interface, so a lambda will do. This one keeps only my own lines: the
// dispatcher is global, and a live Field is logging its own frame rate the whole time.
val seen = mutableListOf<LogEvent>()
val probe = LogSink { e -> if ("mypage" in e.channel) seen += e }

/*
withSink brackets the pair for you. Doing it by hand is a leak waiting for the first
early return: the sink list outlives your box, and LogDispatcher.log wraps every sink
in runCatching, so a leaked sink that throws fails silently and forever.
*/
LogDispatcher.withSink(probe) {
    lprintln("info,mypage", "a plain line")
    lprintln("warning,mypage", "something to look at")
    lprintln("error,mypage,disk", "three tags, and no hierarchy among them")
}

display(
    "main",
    Table(["channel", "tags", "message"], title = "what one sink saw")
        .rows(seen.map { [it.channel, it.channel.split(",").size, it.message] })
        .role("channel", CellRole.ACCENT)
        .expect("tags", because = "a channel is a flat tag list, so every line has at least one") { (it as Int) >= 1 },
)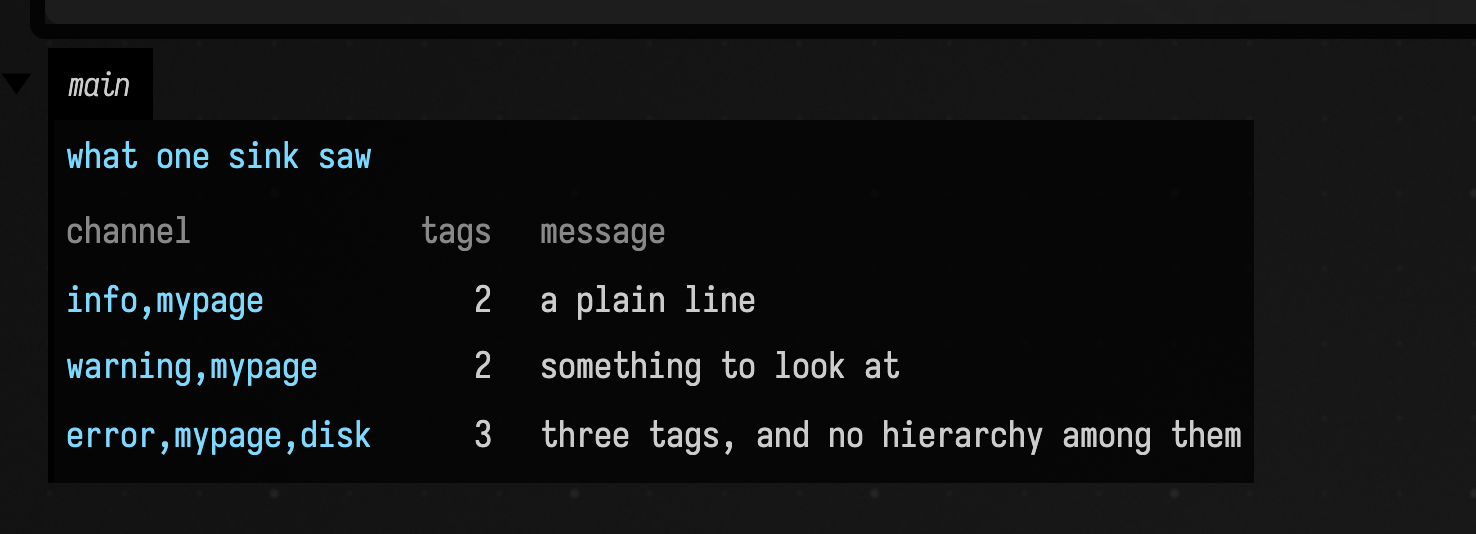
Use withSink rather than a bare addSink from a box. The dispatcher is global, so a sink
that is never removed keeps receiving events for the life of the JVM, and because
LogDispatcher.log wraps each sink in runCatching, one that throws fails silently.
Channel matching: one rule
The console mute set, the pinned console and the log widget's filter all select channels the
same way (Logging.kt:118). A channel is a comma-separated set of tags, and a
selector matches when every one of its tags is among the channel's. Tag order does not matter,
extra tags do not matter, and tags compare exactly, case included.
:::static
import afield.ai.diagnostics.ConsoleMute

// The default mute set holds the selector "info,boxes": a channel is muted when it carries both tags.
val spellings = ["info,boxes", "boxes,info", "info,boxes,extra", "info,Boxes", "boxes"]

display(
    "main",
    Table(
            ["channel string", "isMuted"],
            title = "ConsoleMute matches tags",
            note = "the set this JVM booted with: " + ConsoleMute.channels.sorted().joinToString(", "),
        )
        .rows(spellings.map { [it, ConsoleMute.isMuted(it)] })
        .role("channel string", CellRole.ACCENT)
        .roleBy("isMuted") { if (it == true) CellRole.WARN else CellRole.OK }
        .expect("isMuted", because = "a channel carrying both tags of a selector is muted") { it is Boolean },
)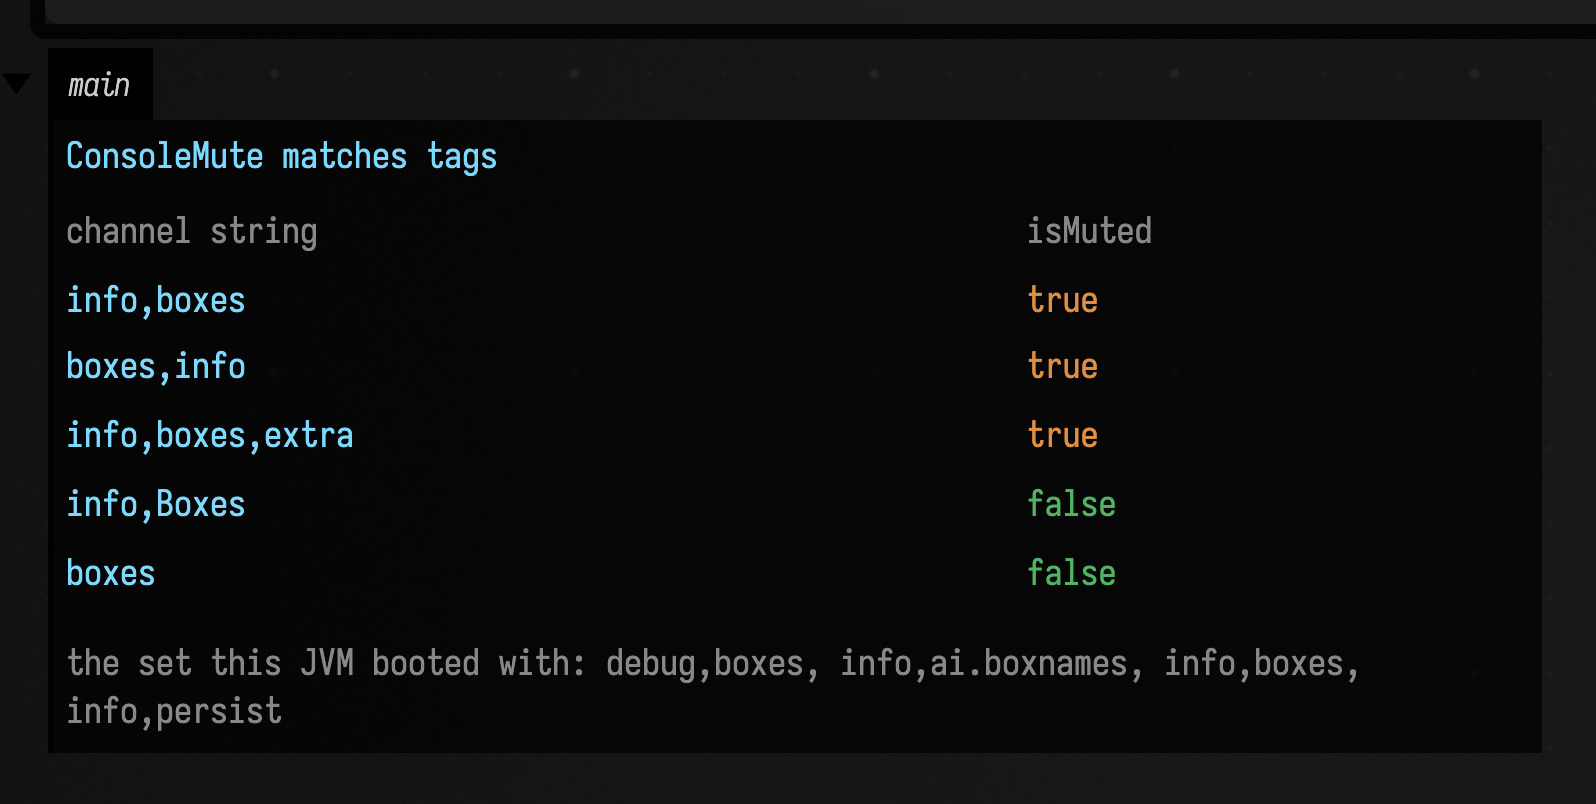
Reordering the tags or adding one still matches; info,Boxes has a different tag, and boxes
alone lacks info. To mute a whole subsystem, name its tag: -Dafield.log.mute=boxes (or
AFIELD_LOG_MUTE=) takes a semicolon-separated list of selectors, and a blank value mutes nothing.
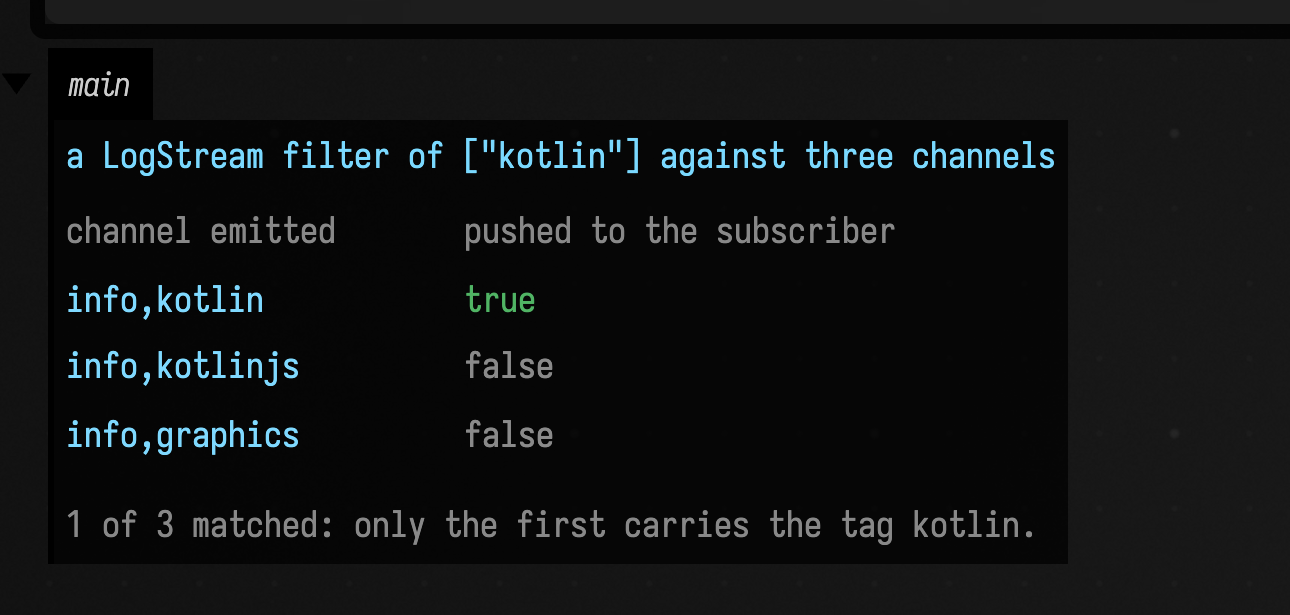
The widget's filter follows the same rule, so a filter for kotlin takes the channels tagged
kotlin and not kotlinjs, the Kotlin/JS build's separate tag:
:::static
import afield.app.diagnostics.logging.lprintln

// Subscribe with the real filter the log widget uses. sinceEpochMs keeps the existing
// 20,000-record archive out of the replay, so what arrives is only what I emit below.
val pushed = mutableListOf<String>()
LogStream.addSubscription(
    "logdoc-tags",
    LogStream.Filter(
        channels = ["kotlin"],
        sinceEpochMs = System.currentTimeMillis(),
        limit = 50,
        tail = true,
    ),
) { json ->
    pushed += json
}

val emitted = ["info,kotlin", "info,kotlinjs", "info,graphics"]
try {
    emitted.forEach { lprintln(it, "«logdoc» a line on $it") }
} finally {
    LogStream.unsubscribe("logdoc-tags")
}

val matched =
    pushed.filter { "«logdoc»" in it }.map { it.substringAfter("\"channel\":\"").substringBefore("\"") }.toSet()

display(
    "main",
    Table(
            ["channel emitted", "pushed to the subscriber"],
            title = "a LogStream filter of [\"kotlin\"] against three channels",
            note = "${matched.size} of ${emitted.size} matched: only the first carries the tag kotlin.",
        )
        .rows(emitted.map { [it, it in matched] })
        .role("channel emitted", CellRole.ACCENT)
        .roleBy("pushed to the subscriber") { if (it == true) CellRole.OK else CellRole.DIM },
)
Muting only affects the console
Muting a channel does not drop the event. Both console sinks check the mute set and
return early (Logging.kt:95 for plain
stdout and PinnedConsole.kt:316 for the
pinned console), and no other sink checks it at all. The event still reaches the web
archive, and still reaches your own sink:
:::static
import afield.ai.diagnostics.ConsoleMute
import afield.ai.diagnostics.LogDispatcher
import afield.ai.diagnostics.LogSink
import afield.ai.diagnostics.withSink
import afield.app.diagnostics.logging.lprintln

val arrived = mutableSetOf<String>()
val probe = LogSink { e -> if ("«logdoc»" in e.message) arrived += e.channel }

val channels = ["info,boxes", "info,mypage"] // the first is muted by default
LogDispatcher.withSink(probe) {
    channels.forEach { lprintln(it, "«logdoc» a line on $it") }
}

display(
    "main",
    Table(
            ["channel", "muted on the console", "reached my sink"],
            title = "muting keeps a line off the console, not out of the layer",
            note =
                "${arrived.size} of ${channels.size} arrived. Mute is for a channel too chatty " +
                    "for a terminal, not for one you want gone.",
        )
        .rows(channels.map { [it, ConsoleMute.isMuted(it), it in arrived] })
        .role("channel", CellRole.ACCENT)
        .roleBy("muted on the console") { if (it == true) CellRole.WARN else CellRole.DIM }
        .roleBy("reached my sink") { if (it == true) CellRole.OK else CellRole.BAD }
        .expect("reached my sink", because = "muting is a console policy, so every line still arrives") { it == true },
)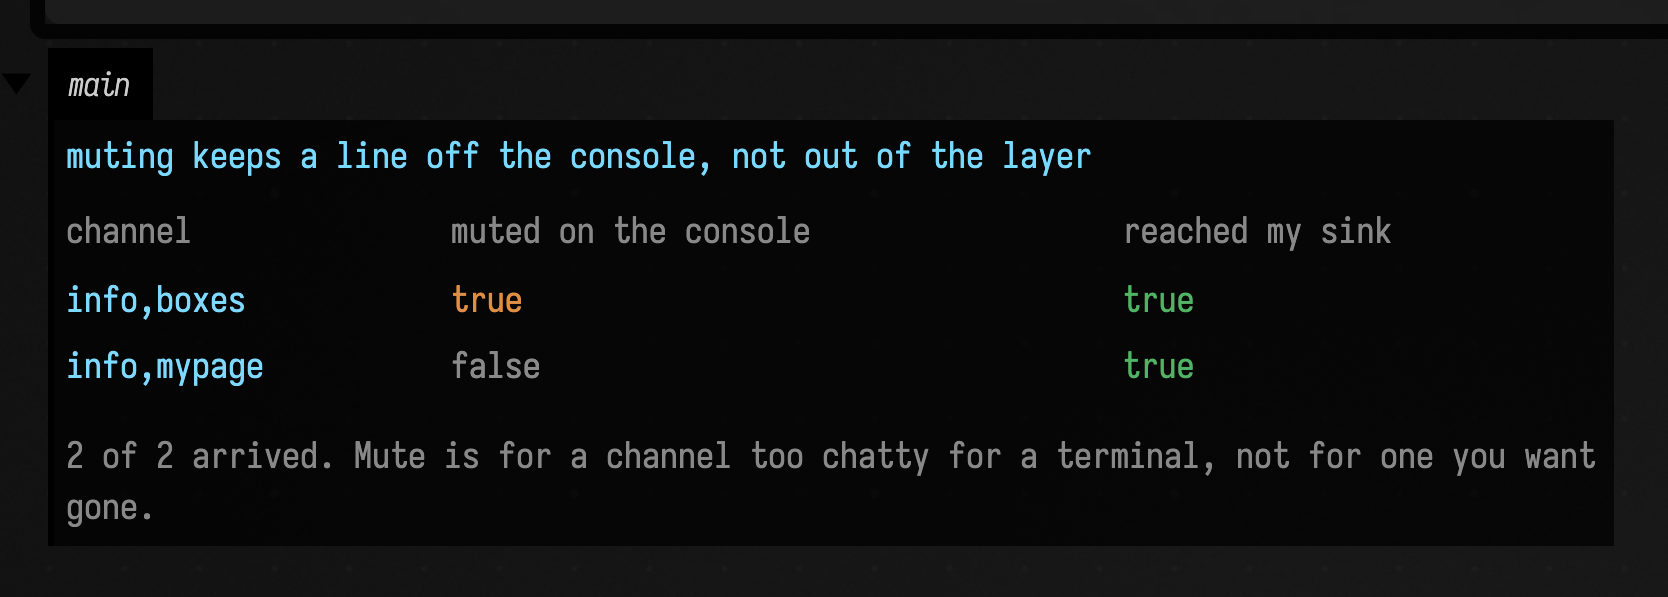
The muted line was still delivered. Four channels are muted
by default (info,boxes, info,persist, info,ai.boxnames and debug,boxes), and every one of
them is still in the log widget and still in the archive when you go looking for it.
Blocks and the indent
lblock brackets a scope with a BEGIN and an END event sharing a blockId, so a consumer
can fold the lines between them:
:::static
import afield.ai.diagnostics.LogDispatcher
import afield.ai.diagnostics.LogEvent
import afield.ai.diagnostics.LogSink
import afield.ai.diagnostics.withSink
import afield.app.diagnostics.logging.lblock
import afield.app.diagnostics.logging.lprintln

val all = mutableListOf<LogEvent>()
val probe = LogSink { e -> all += e }

LogDispatcher.withSink(probe) {
    lblock("info,logdoc", "«logdoc» outer") {
        lprintln("info,logdoc", "«logdoc» inside outer")
        lblock("info,logdoc", "«logdoc» inner") {
            lprintln("info,logdoc", "«logdoc» inside inner")
        }
    }
}

// An END event's message is just its own id, so it is picked up by blockId rather than by text.
val mineIds = all.filter { "«logdoc»" in it.message }.mapNotNull { it.blockId }.toSet()
val mine = all.filter { "«logdoc»" in it.message || it.blockId in mineIds }
val deepest = mine.filter { it.boundary == null }.maxByOrNull { it.indent.length }

display(
    "main",
    Table(
            ["depth", "boundary", "block", "message"],
            title = "two nested lblocks, as the dispatcher saw them",
            note =
                "the deepest line's raw indent: '" +
                    (deepest?.indent?.replace("\t", "\\t") ?: "") +
                    "' — block ids and tabs, not spaces",
        )
        .rows(
            mine.map { e ->
                [
                    e.indent.split("\t").count { it.isNotEmpty() },
                    e.boundary?.name ?: "—",
                    e.blockId?.take(8) ?: "—",
                    e.message.substringBefore(" - '"),
                ]
            },
        )
        .role("message", CellRole.ACCENT)
        .expect("depth", because = "two nested blocks cannot nest deeper than two") { (it as Int) <= 2 },
)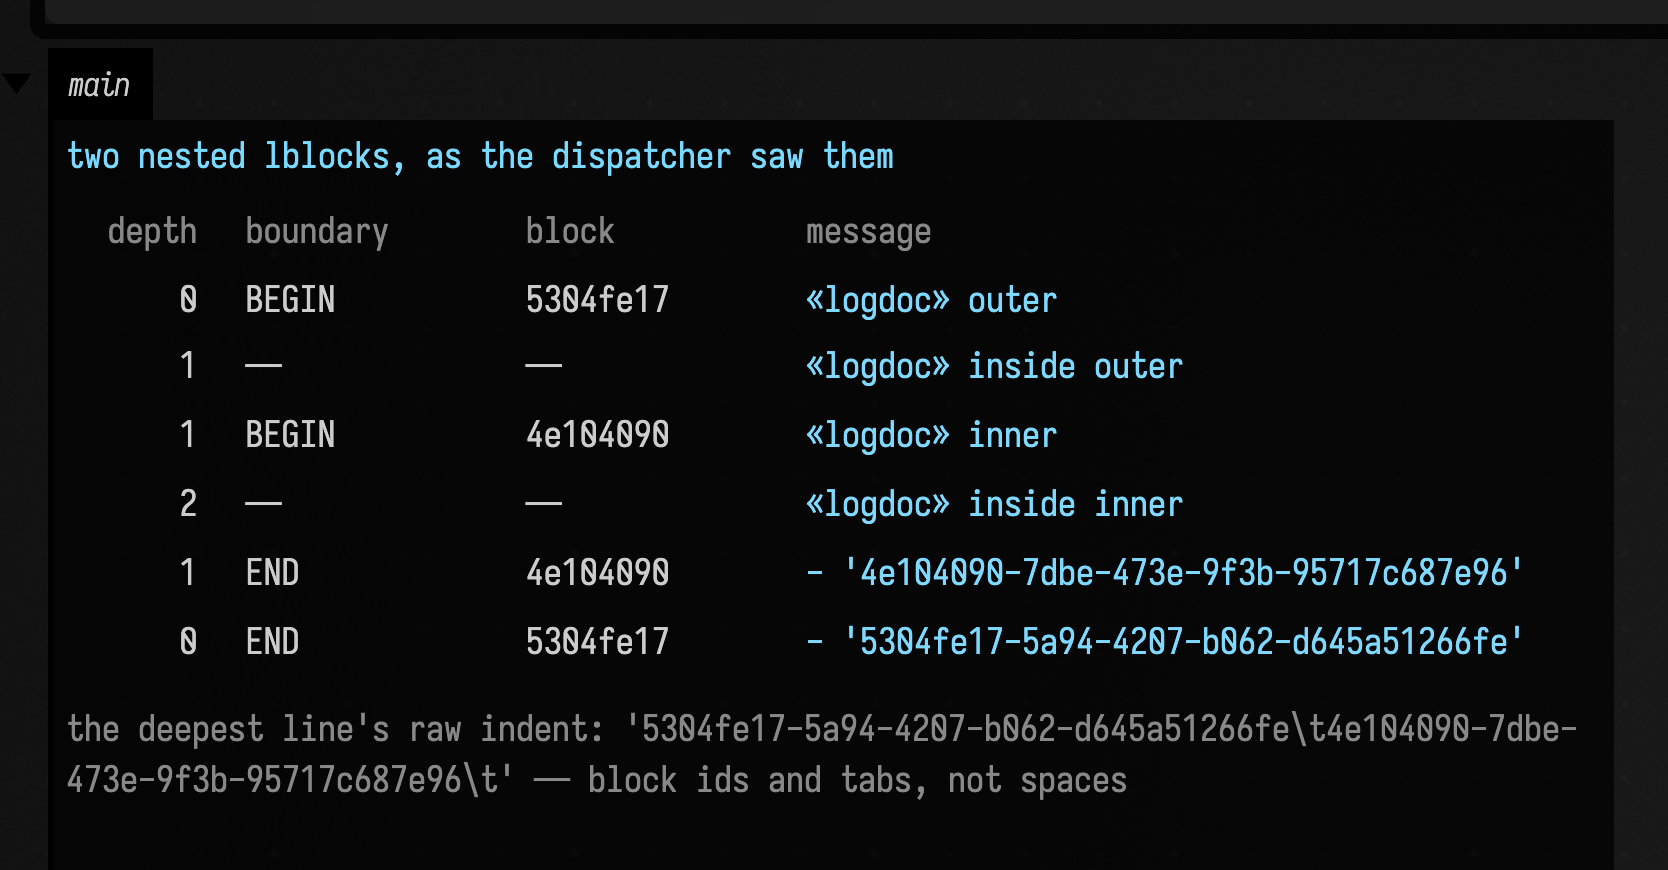
The footnote shows how nesting is stored: it is carried in an indent string kept separately for each
thread, and it holds one block UUID and a tab per level rather than spaces
(logger.kt:69). PinnedConsole parses those tokens back out to find
which open block a line belongs to, which is what they are for. On a plain terminal
StdoutLog prints only the depth, two spaces per level.
Because indent is per thread, a block does not nest across threads: work handed to
another thread inside an lblock logs at depth zero.
Stat lines and the heatmap
A channel that reports a number every frame gets special treatment, and the contract is
just a string format: key=value or key: value, optionally with a unit
(StatsHeatmap.kt:19). StatsHeatmap colours each numeric
token by whether it rose or fell since the same channel last reported that key: blue for a
sharp fall, through grey for unchanged, to red for a sharp rise, saturating at ±50%. Use
formatMillis for durations and the unit comes out matching that grammar, so a slow compile
reads 1.63s rather than 1629ms:
:::static
import afield.app.diagnostics.logging.StatsHeatmap
import afield.app.diagnostics.logging.formatMillis

val durations = [120_000L, 3_400_000L, 47_000_000L, 250_000_000L, 1_630_000_000L, 12_400_000_000L]
val ladder =
    Table(
            ["nanoseconds", "formatted"],
            title = "formatMillis keeps digits where they matter",
            note = "more digits below a millisecond, plain integers past 100ms, decimal seconds past a second",
        )
        .rows(durations.map { [it, formatMillis(it)] })
        .role("formatted", CellRole.ACCENT)
        .expect("formatted", because = "the unit is part of the returned string") {
            (it as String).endsWith("ms") || it.endsWith("s")
        }

val line = "fps=61.2 upload=3.4MB net:102% dropped=0"
val torn =
    Table(
            ["fragment", "treated as"],
            title = "how a stats line is torn into colourable tokens",
            note =
                "history is kept per channel and per key, so two unrelated metrics sharing one " +
                    "channel do not colour each other",
        )
        .rows(
            StatsHeatmap.fragments("logdoc-demo", line).map {
                ["'${it.text}'", if (it.style == null) "plain text" else "number"]
            },
        )
        .roleBy("treated as") { if (it == "number") CellRole.ACCENT else CellRole.DIM }

markdown(
    "main",
    """
    ${ladder.h}

    ${torn.h}
"""
        .trimIndent(),
)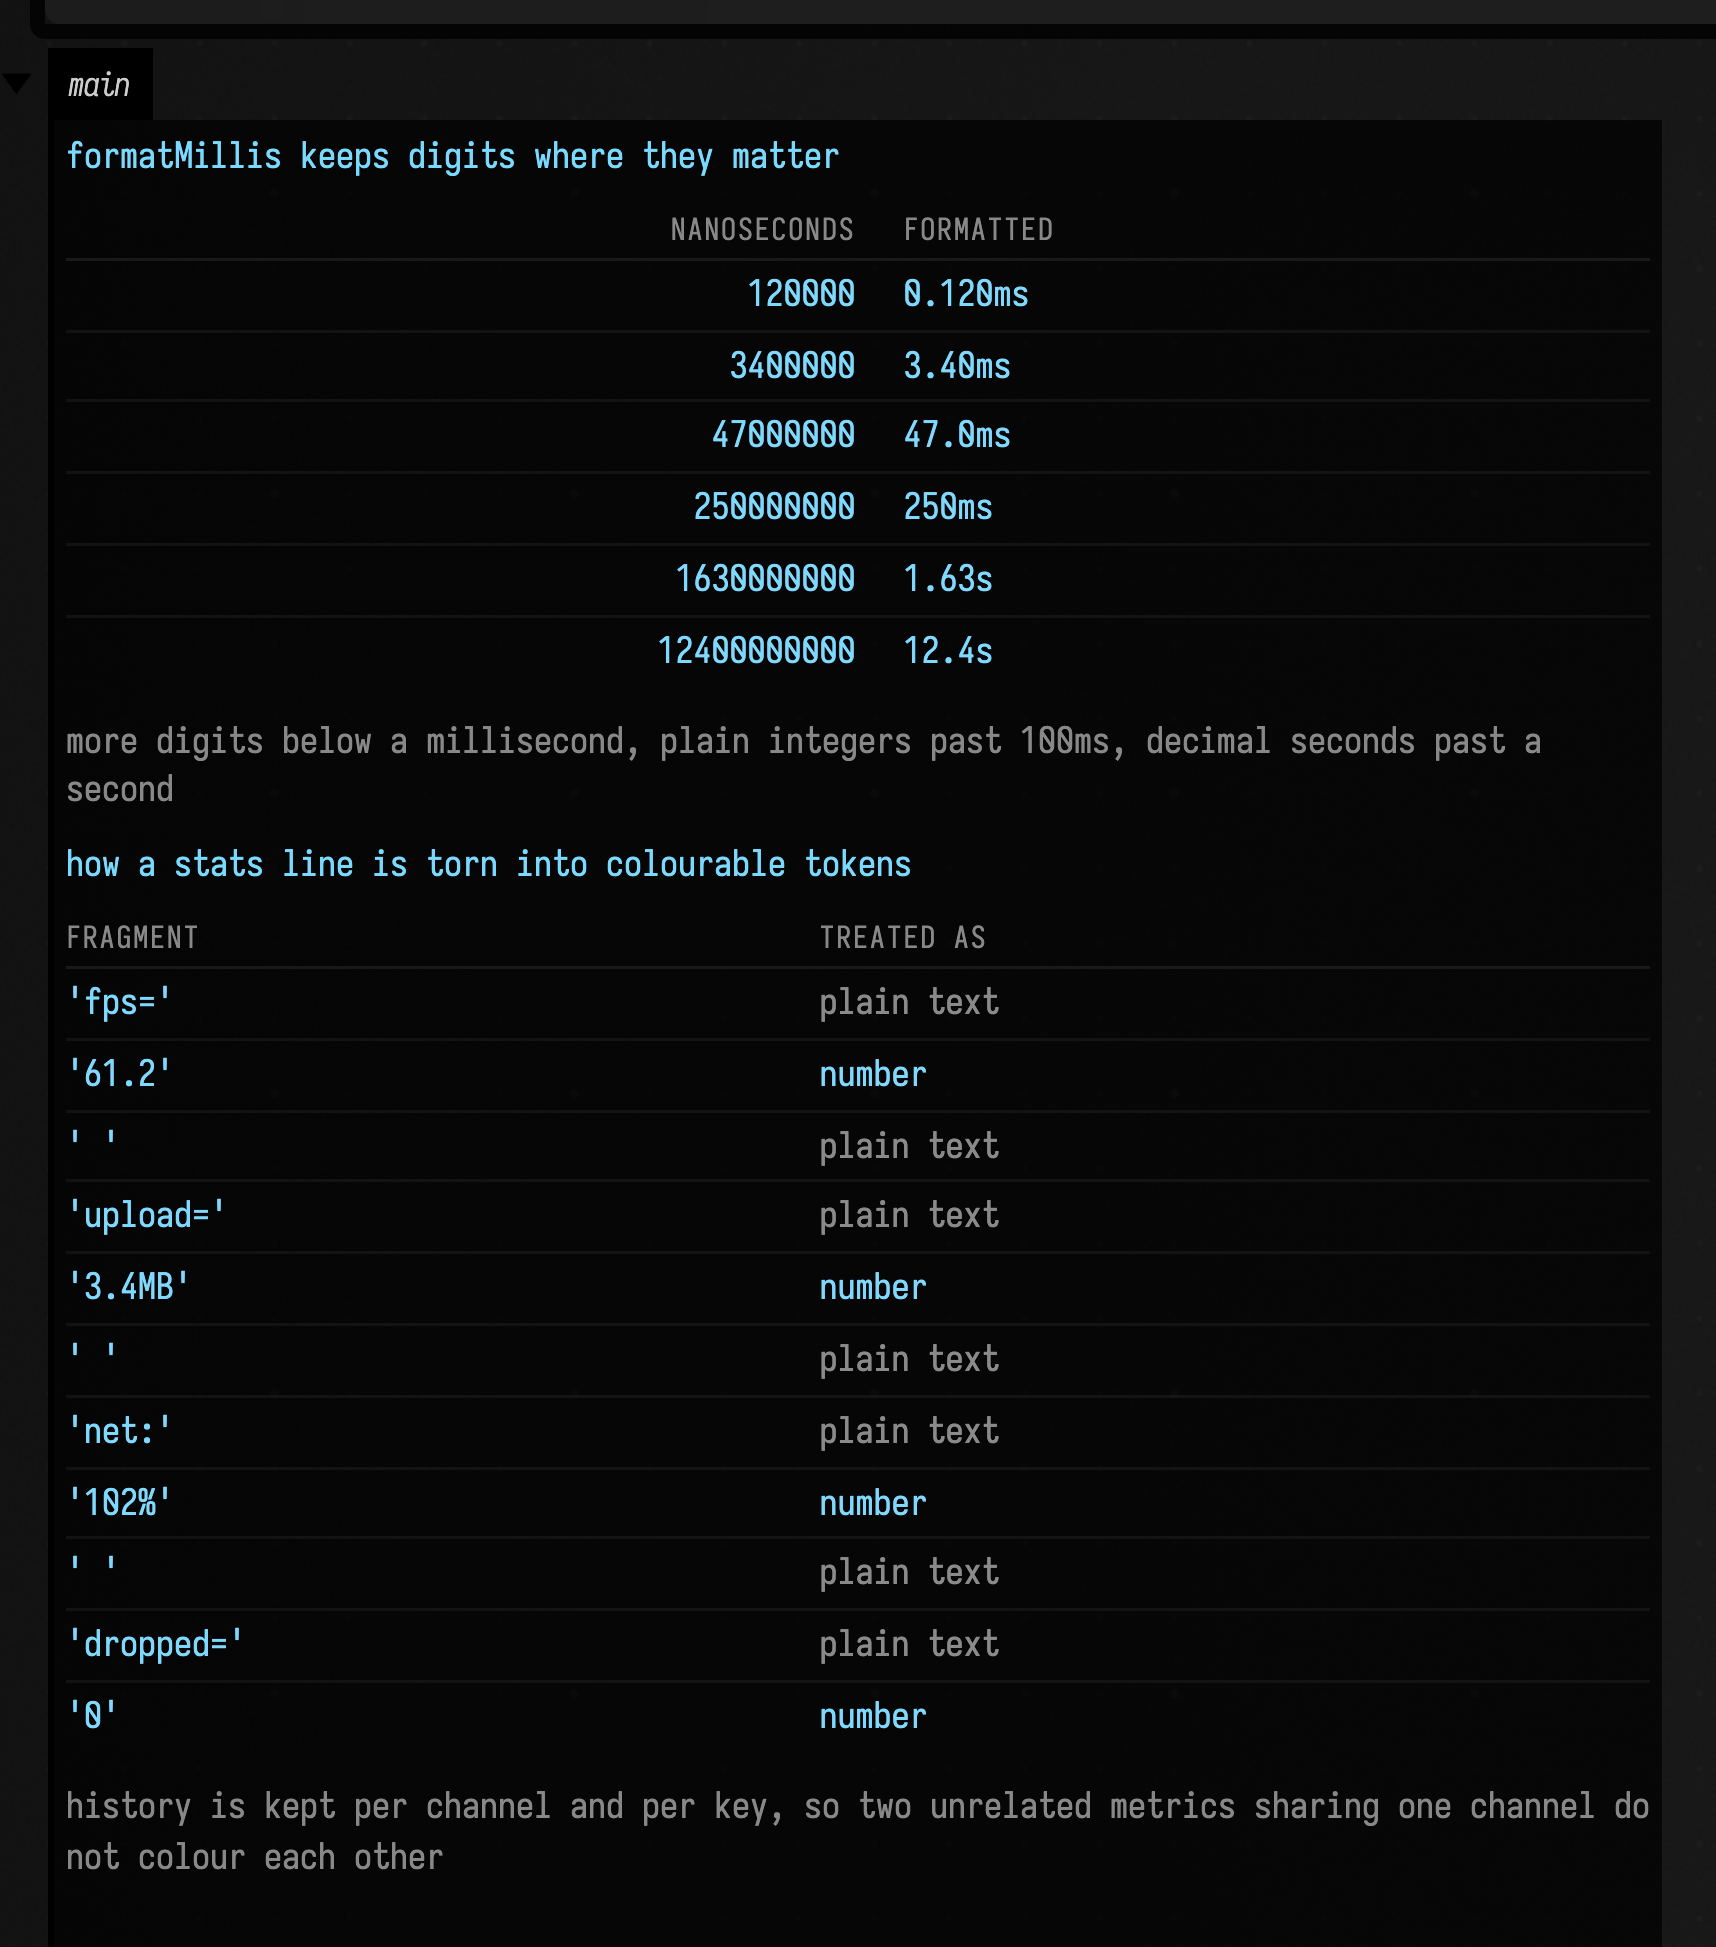
Each numeric token is styled and everything between them is left alone.
The pinned console
When Field runs in a terminal, the channels that report every frame do not scroll. They sit
in a small fixed region at the top while everything else scrolls beneath, so a frame-rate
line stays readable. To see it, run ./gradlew runJvm in a terminal.
The mechanism is one ANSI scroll region (DECSTBM): the top rows are fenced off, so an
ordinary println scrolls in the region below them with no changes to the code that
prints it. The header is repainted only when a pinned value actually
changes. Six channels are pinned by default
(PinnedConsole.kt:69),
in that order, and the order matters: matchedPin takes the first pinned tag present in a
channel, so info,perf,fps lands on the fps row and only the leftover perf lines fall
through to the perf row. Add your own with AFIELD_PIN_CHANNELS, or at runtime with
PinnedConsole.pin("mytag").
If stdout is not an interactive TTY, or ANSI control is
unavailable, or Mordant reports a legacy Windows console, pinning switches off and every
event scrolls, with would-be-pinned lines tagged pin so they stay visible.
AFIELD_PIN_DISABLE=1 forces that path.
Why there is no figure of the pinned header
There is no figure of the header on this page and there cannot be one: a docs capture drives a box in a headless Field whose stdout is a
pipe, which is exactly the condition under which the pinned console switches itself
off, so the fallback is what would be photographed. matchedPin and
PinnedConsoleSink are private, so the row-routing rule above is stated from its
source line rather than executed.
Stderr and the session error log
System.err never passes through the dispatcher. Ktor logs through SLF4J, and slf4j-simple
writes to stderr, so an unhandled-request stack trace reaches none of the machinery above.
On its own it would not survive the pinned console either: it is not in the console's
scrollback ring, the pager repaints from that ring and clears each row as it goes, and
lines that scroll out of a DECSTBM region are not kept in the terminal's own scrollback.
SessionErrorLog handles stderr. It tees the stream
(SessionErrorLog.kt:113)
so every byte still reaches the real stderr and nothing watching this process sees a change;
it appends every line to build/logs/session-<stamp>-pid<pid>.log, which is the durable
greppable record, flushed per line so the last thing stderr said survives a crash; and it
recognises a stack trace or an slf4j ERROR line and raises it as a sticky pinned panel,
the one region of the screen a repaint will not reclaim. Twenty session files are kept and
one is capped at 32 MB.
So when something has gone wrong and the terminal is no help, that file is where to look.
Where the lines end up
| Sink | Where | Honours the mute set |
|---|---|---|
StdoutLog |
the terminal, with the channel dimmed and italic | yes |
PinnedConsoleSink |
the terminal, pinned rows plus scrollback | yes |
LogStream |
a 20,000-record ring (logstream.kt:27), served to the log widget over the __logs__ websocket |
no |
NotifyLog |
stdout, plus a desktop notification, deduped within a second | via StdoutLog |
SilentLog |
nowhere, on purpose | n/a |
SaveReloadLog and TraceLogger keep their own files under ~/.afield/logs/ and send a line for
each entry through the dispatcher too: save and reload timings on info,persist,savereload (muted
on the console with the rest of info,persist, and shown in the log widget), and one line per AI
request trace on info,ai.trace when tracing is on. AiToolIoLogger writes its tool records to
files and sends one info,ai.toolio line naming each file.
Reference
The generic core is afield.ai.diagnostics.Logging: LogEvent, LogSink, LogDispatcher,
ConsoleMute, StdoutLog. The entry points and the terminal live in afield.app.diagnostics.logging:
lprintln, lprint, lblock, indent, formatMillis, PinnedConsole, StatsHeatmap,
SessionErrorLog, SaveReloadLog. The web sink is afield.app.server.LogStream, which serves
the log widget over the __logs__ websocket handler.