Tuning by Gaussian process: optimisation and A/B preference
Some parameters are tuned by trying them: a drawing's three dials, a synth patch, a simulation's constants. When each try is slow, or the judge is you, the number of tries is what matters. The box below is one such search. The grey curve is a target, and three dials (how far the curve wobbles, where the wobble starts, and how squashed it is) have to be set to match it. On the left are the first five guesses, spread over the ranges; on the right is the best of thirty tries. The chart shows how close the search had come after each try.
:::static
// A closed curve with three dials: how far it wobbles, where the wobble starts, and how much
// it is squashed sideways. One setting of the dials is the target; pretend we cannot see it.
fun curve(p: Map<String, Double>) =
    (0..300).map { i ->
        val t = 2 * PI * i / 300
        val r = 1 + p["wobble"]!! * cos(5 * t + p["phase"]!!)
        (p["squash"]!! * r * cos(t)) to (r * sin(t))
    }
val target = curve(mapOf("wobble" to 0.32, "phase" to 1.1, "squash" to 0.8))
fun misfit(p: Map<String, Double>) =
    curve(p).zip(target).sumOf { (a, b) ->
        (a.first - b.first).pow(2) + (a.second - b.second).pow(2)
    } / target.size

// Each step fits a Gaussian process to every try so far and evaluates where it expects
// the biggest improvement. Thirty tries, minimising.
val opt = GpOptimizer("wobble" to 0.0..0.6, "phase" to 0.0..2 * PI, "squash" to 0.4..1.4, minimize = true)
repeat(30) { opt.step { misfit(it) } }

fun draw(pts: List<Pair<Double, Double>>, dx: Double, colour: Vec4, width: Double) =
    FLine().also { f ->
        f.breakNext()
        pts.forEach { (x, y) -> f.lineTo(dx + 100 * x, -100 * y) }
        f.color = colour
        f.thickness = width
    }
val grey = vec(0.6, 0.6, 0.6, 1.0)
lines(
    [draw(target, 0.0, grey, 6.0)] +
        opt.history.take(5).map { draw(curve(it.parameters), 0.0, vec(0.2, 0.4, 0.9, 0.35), 1.0) } +
        draw(target, 320.0, grey, 6.0) +
        draw(curve(opt.best!!.parameters), 320.0, vec(0.9, 0.2, 0.2, 1.0), 2.0),
    w = 640.0,
    h = 300.0,
    fitToSize = true,
)
showChart(
    "best misfit so far" to opt.bestSoFar.map { log10(it) },
    channel = "convergence",
    title = "log10 misfit after each try",
    xLabel = "try",
    yLabel = "log10 misfit",
)

println(
    "best after 30 tries: misfit %.2e at %s"
        .format(
            opt.best!!.value,
            opt.best!!.parameters.mapValues { it.value.f3 },
        ),
)
println("first five tries (blue, left): " + opt.history.take(5).joinToString { it.value.f3 })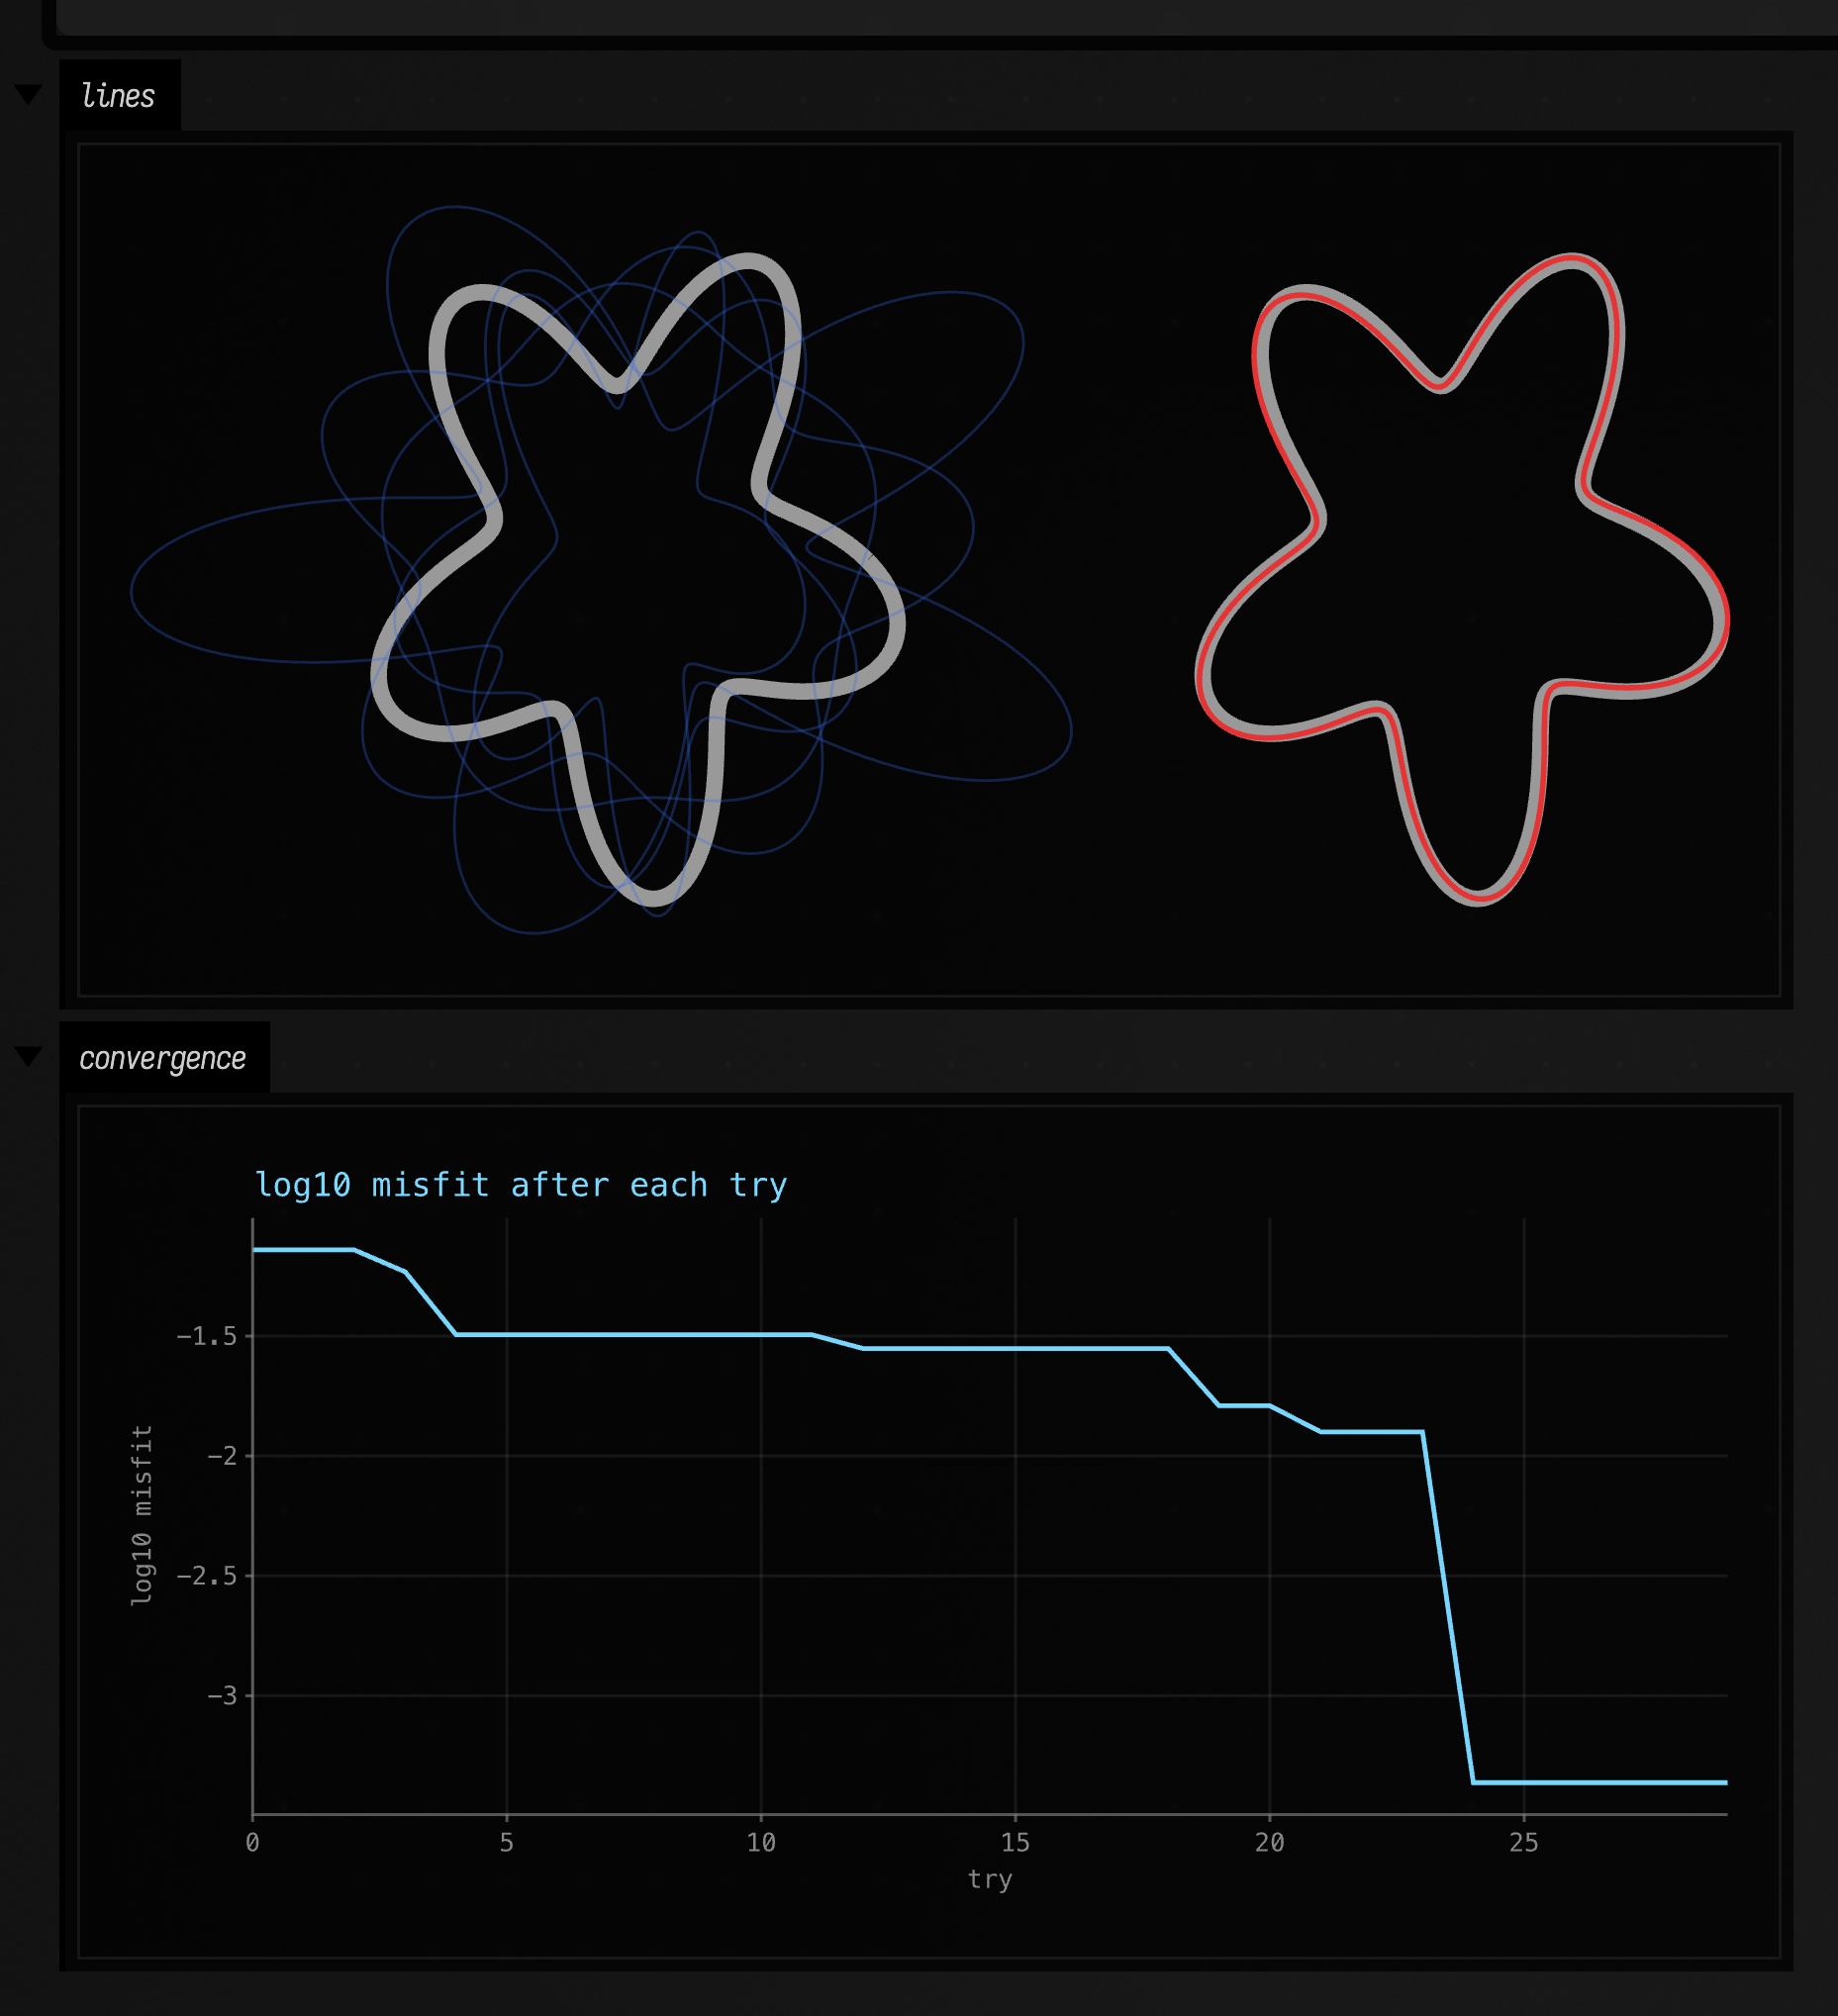
Field has two tools for this, both in afield.math.gp and so available in every box without an
import. Each one fits a Gaussian process to the tries so far and uses
it to choose the next one.
GpOptimizersearches for the setting that maximises (or minimises) a number you can compute.GpPreferencesearches for the setting you like best, from nothing more than your answers to "A or B?".
Optimising a number
Name each parameter with its range, then call step with the thing to score. Here the score is
how far a three-dial curve is from a target curve:
val opt = GpOptimizer("wobble" to 0.0..0.6, "phase" to 0.0..2 * PI, "squash" to 0.4..1.4, minimize = true)
repeat(30) { opt.step { p -> misfit(p) } }

println(opt.best) // GpTrial(parameters={wobble=…, phase=…, squash=…}, value=…)
println(opt.bestSoFar) // the best value after each try
p is a Map<String, Double> of the parameter values to try. The first few tries (four, or the
number of parameters plus two) are spread over the ranges. After that, every step fits a GP to
everything tried so far and picks the point with the largest expected improvement on the best
value: somewhere it expects a better score, or somewhere it does not yet know, whichever is
worth more.
You can drive the loop yourself instead of handing over a function. This is how to use it when the score comes from somewhere else, such as a render you time or a slider you set:
val p = opt.suggest() // what to try next
opt.observe(p, measure(p)) // what it scored
val four = opt.suggest(4) // four to try at once, spread apart
opt.predict(p) // the model's mean and variance there
GpOptimizer maximises unless you pass minimize = true. Other options:
acquisition = GpAcquisition.UpperConfidenceBound(beta = 2.0)chooses by mean +beta× standard deviation, which explores more asbetagrows.ExpectedImprovement(xi = 0.01)is the default.seedmakes a run repeatable: the same seed and the same scores give the same suggestions.hyperparametersshows the fitted length scale of each parameter (in units of its range) and the noise. A short length scale means the score changes quickly along that parameter.
Thirty tries, not three thousand
Each step refits a GP to every observation, which takes longer as tries accumulate. It is meant for tens to a few hundred evaluations, where each one is expensive. For a score that costs microseconds, a grid or random search is quicker. Ranges should be finite, and a parameter that only takes whole numbers can be rounded inside your score function.
Learning what you prefer
GpPreference takes the same named ranges. nextPair() gives two settings to show, and choose
records which one won:
:::static
// A rosette with four dials: petals, depth, curl and hue. Say which of two you
// like better, and the model proposes the next two.
fun rosette(p: Map<String, Double>, dx: Double) =
    FLine().also { f ->
        val petals = p["petals"]!!.roundToInt()
        f.breakNext()
        for (i in 0..600) {
            val t = 2 * PI * i / 600
            val r = 1 + p["depth"]!! * cos(petals * t) + 0.15 * p["depth"]!! * cos(2 * petals * t + 3 * p["curl"]!!)
            val x = dx + 90 * r * cos(t + p["curl"]!! * sin(petals * t) * 0.3)
            val y = -90 * r * sin(t + p["curl"]!! * sin(petals * t) * 0.3)
            f.lineTo(x, y)
        }
        f.color = okhsl(p["hue"]!!, 0.8, 0.55, 1.0)
        f.thickness = 2.0
    }

val taste = GpPreference("petals" to 3.0..9.0, "depth" to 0.1..0.8, "curl" to 0.0..1.0, "hue" to 0.0..360.0)
var pair = taste.nextPair()

fun show() {
    lines(rosette(pair.first, 0.0), rosette(pair.second, 300.0), w = 600.0, h = 280.0, fitToSize = true)
    val fav = taste.best
    display(
        "status",
        "<div>%d answers. A (left) vs B (right).%s</div>"
            .format(
                taste.comparisons.size,
                if (fav == null) "" else " Favourite so far: " + fav.mapValues { it.value.f2 },
            ),
    )
}
fun answer(aWins: Boolean) {
    taste.choose(pair, aWins)
    pair = taste.nextPair()
    show()
}

controlGroup {
    button("A is better") { down -> if (down) answer(true) }
    button("B is better") { down -> if (down) answer(false) }
}
show()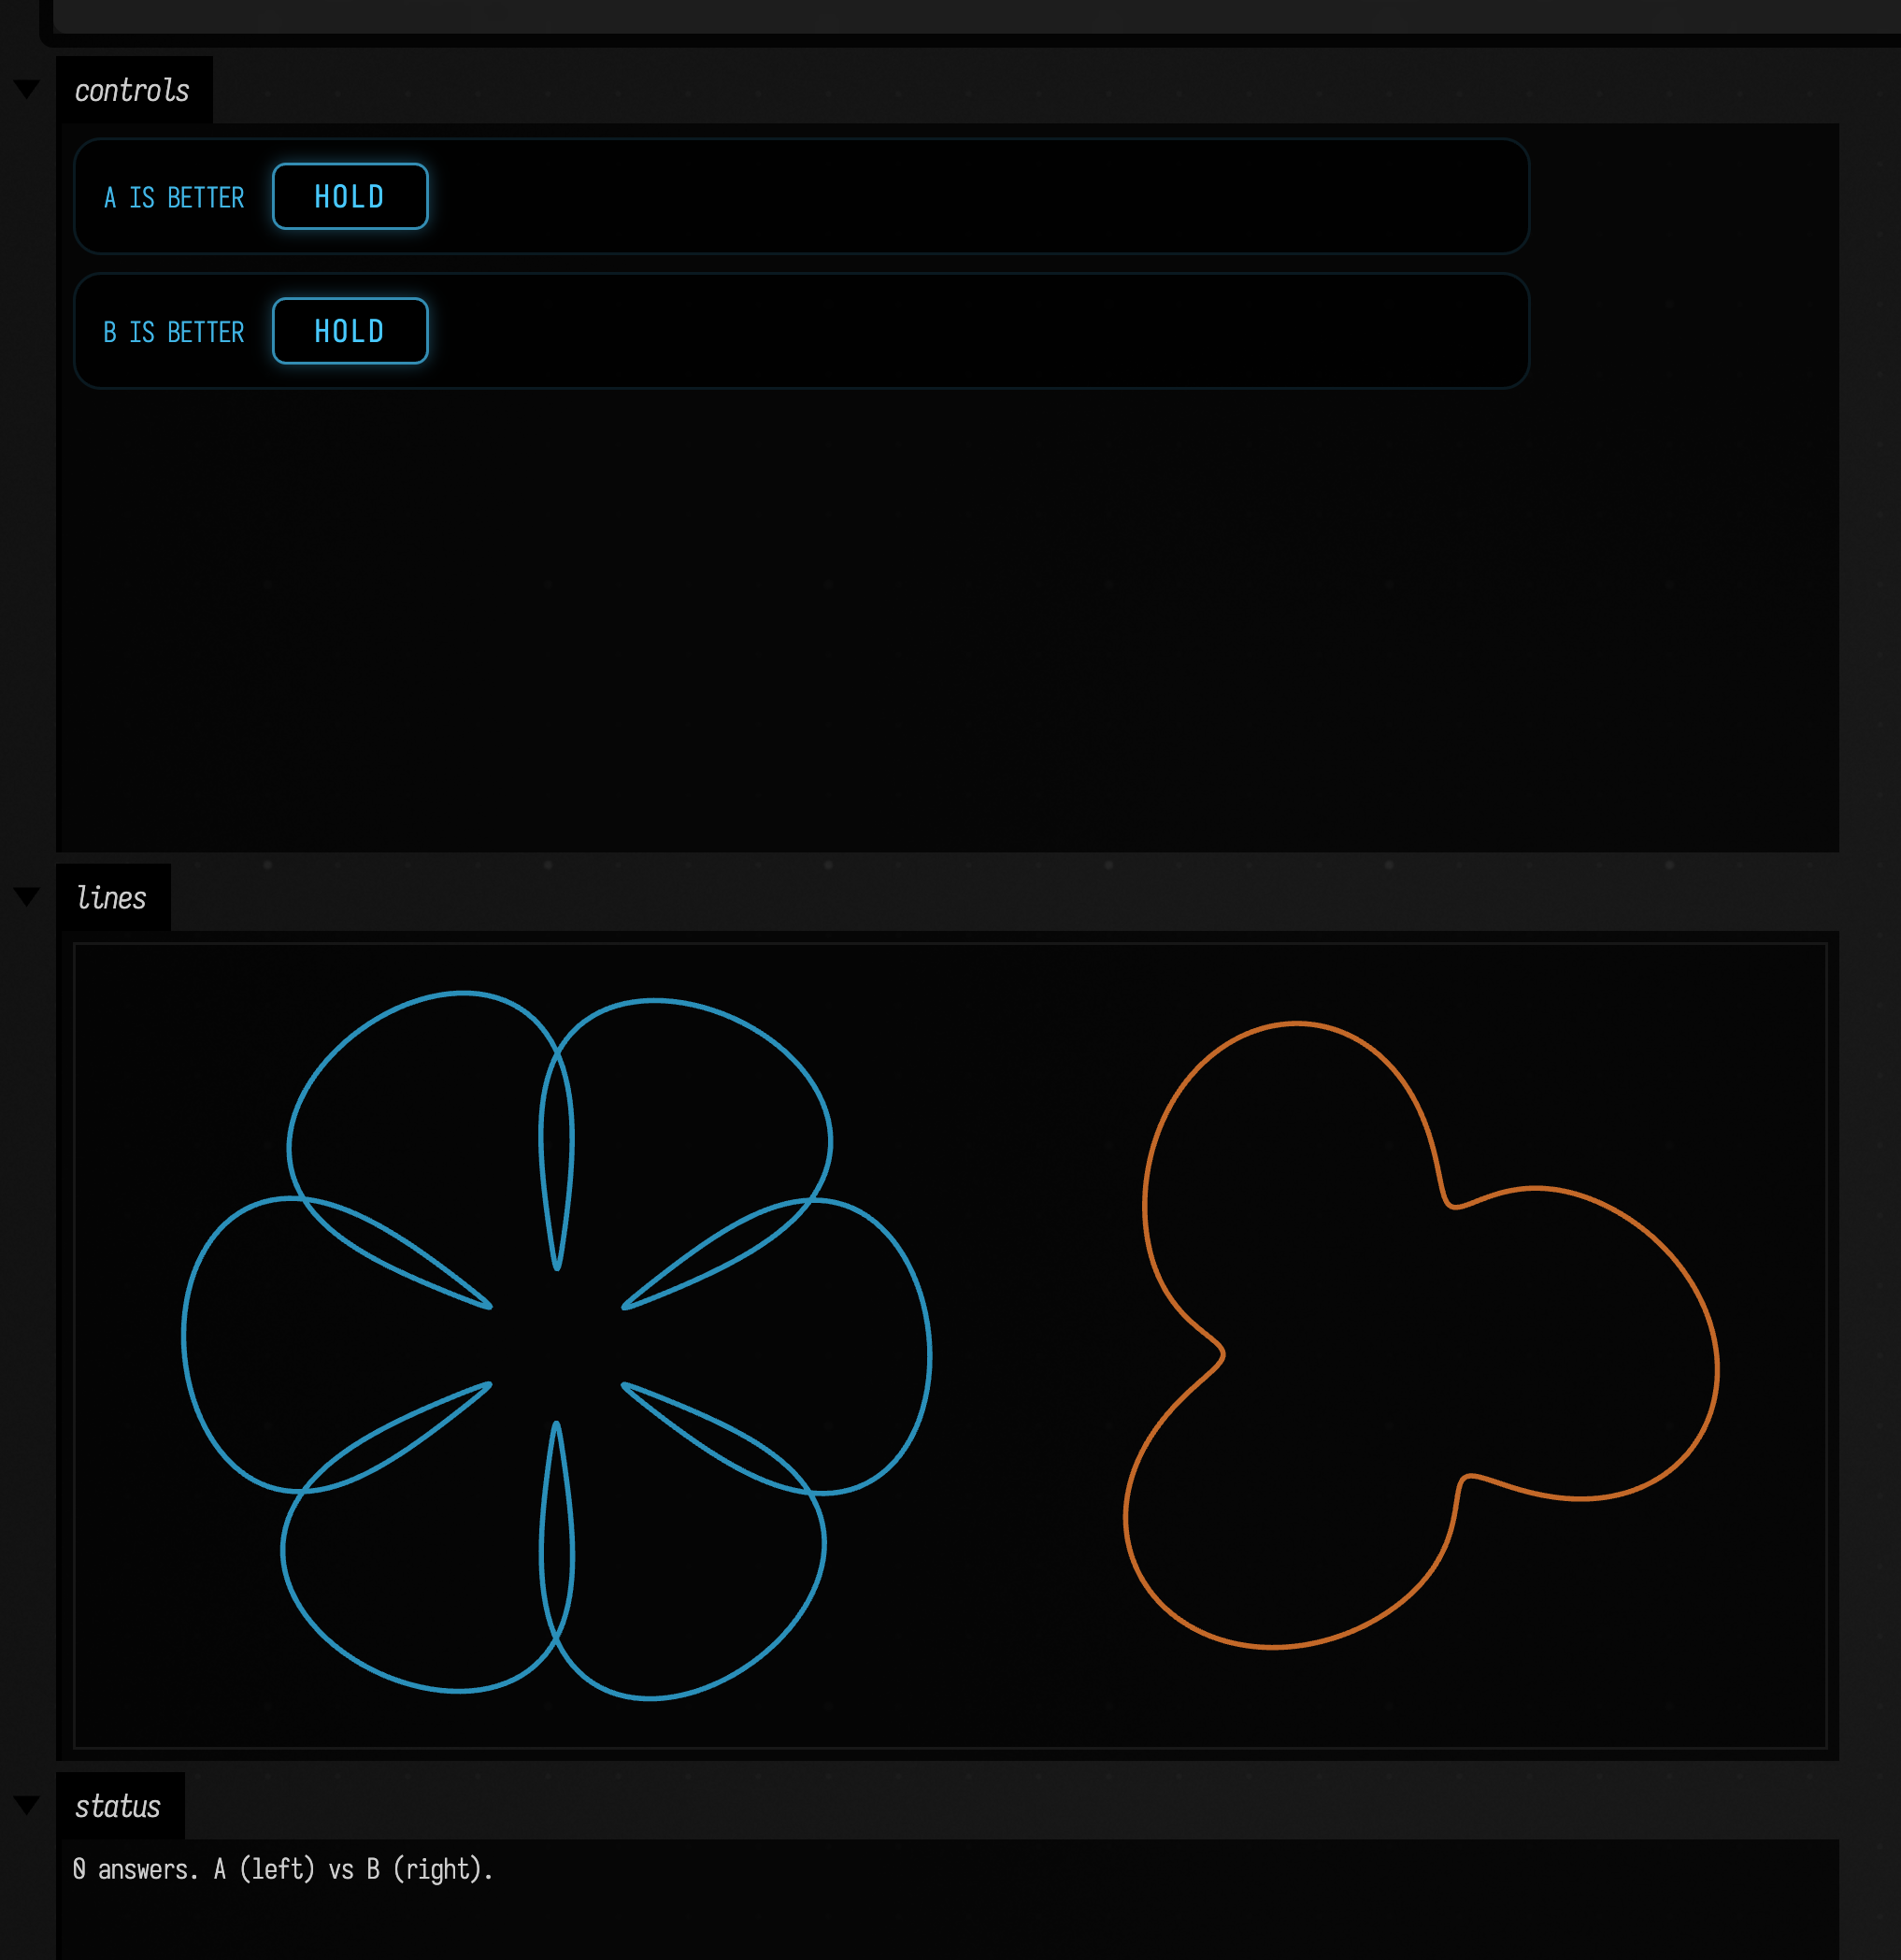
Each answer updates a GP over a hidden "how much you like it" score. The next pair is the
current favourite against the setting with the most promise: one that is likely better, or
that the model knows little about. taste.best is the favourite so far, and taste.ranking()
lists every setting you have seen, best first.
To see the model learn without anyone clicking, replace the person with a simulated judge: code
that calls choose with whichever of the pair scores higher under a taste we know. This judge
likes deep, barely curled, five-petalled blue rosettes. After twenty-four answers the box draws
the favourite after every six, then the judge's ideal past a dividing line, and charts what the
model believes about hue.
:::static
/*
The same loop with the human replaced by a judge whose taste we know: it likes dark-blue
five-petalled rosettes, deep and barely curled. Twenty-four answers, and we draw the
model's favourite after every six, then - past a dividing line - the judge's ideal, in its
own colour, so shape and colour can both be compared.
*/
fun rosette(p: Map<String, Double>, dx: Double) =
    FLine().also { f ->
        val petals = p["petals"]!!.roundToInt()
        f.breakNext()
        for (i in 0..600) {
            val t = 2 * PI * i / 600
            val r = 1 + p["depth"]!! * cos(petals * t) + 0.15 * p["depth"]!! * cos(2 * petals * t + 3 * p["curl"]!!)
            val x = dx + 90 * r * cos(t + p["curl"]!! * sin(petals * t) * 0.3)
            val y = -90 * r * sin(t + p["curl"]!! * sin(petals * t) * 0.3)
            f.lineTo(x, y)
        }
        f.color = okhsl(p["hue"]!!, 0.8, 0.55, 1.0)
        f.thickness = 2.0
    }
val ideal = mapOf("petals" to 5.0, "depth" to 0.6, "curl" to 0.1, "hue" to 250.0)
fun utility(p: Map<String, Double>) =
    -((p["petals"]!! - 5.0) / 6).pow(2) -
        ((p["depth"]!! - 0.6) / 0.7).pow(2) -
        (p["curl"]!! - 0.1).pow(2) -
        ((p["hue"]!! - 250.0) / 360).pow(2)

val taste = GpPreference("petals" to 3.0..9.0, "depth" to 0.1..0.8, "curl" to 0.0..1.0, "hue" to 0.0..360.0)
val snapshots = mutableListOf<Map<String, Double>>()
repeat(24) { round ->
    val pair = taste.nextPair()
    taste.choose(pair, aWins = utility(pair.first) > utility(pair.second))
    if ((round + 1) % 6 == 0) snapshots += taste.best!!
}
val divider = 380.0 * snapshots.size - 130.0
val separator = FLine().moveTo(divider, -170.0).lineTo(divider, 170.0).also {
    it.color = vec(0.7, 0.7, 0.7, 1.0)
    it.thickness = 1.5
}
lines(
    snapshots.mapIndexed { i, p -> rosette(p, 380.0 * i) } + separator + rosette(ideal, 380.0 * snapshots.size + 120.0),
    w = 1000.0,
    h = 200.0,
    fitToSize = true,
)

// What the model believes about colour: utility relative to its favourite as the hue sweeps,
// with the other dials held at the favourite's. Answers only fix differences, hence relative.
val best = taste.best!!
val hues = (0..72).map { it * 5.0 }
val u = hues.map { taste.utilityRelativeTo(best, best + ("hue" to it)) }
val chart =
    Chart(title = "utility vs hue, relative to the favourite", xLabel = "hue", yLabel = "u - u(favourite)")
        .line("+2 sd", hues, u.map { it.mean + 2 * it.std }, color = vec(1.0, 0.55, 0.2, 0.5))
        .line("-2 sd", hues, u.map { it.mean - 2 * it.std }, color = vec(1.0, 0.55, 0.2, 0.5))
        .line("mean", hues, u.map { it.mean }, color = vec(1.0, 0.55, 0.2, 1.0), thickness = 3.0)
        .vrule(250.0, "judge's ideal hue")
chart.width = 600.0
chart.height = 280.0
showChart(chart, channel = "utility")
snapshots.forEachIndexed { i, p ->
    println(
        "after %2d answers: %s  utility %.3f".format(6 * (i + 1), p.mapValues { it.value.f2 }, utility(p)),
    )
}
println(
    "ideal utility 0; a random rosette averages %.3f"
        .format(
            (0 until 200)
                .map {
                    java.util.Random(it.toLong()).let { r ->
                        mapOf(
                            "petals" to 3 + 6 * r.nextDouble(),
                            "depth" to 0.1 + 0.7 * r.nextDouble(),
                            "curl" to r.nextDouble(),
                            "hue" to 360 * r.nextDouble(),
                        )
                    }
                }
                .map { utility(it) }
                .average(),
        ),
)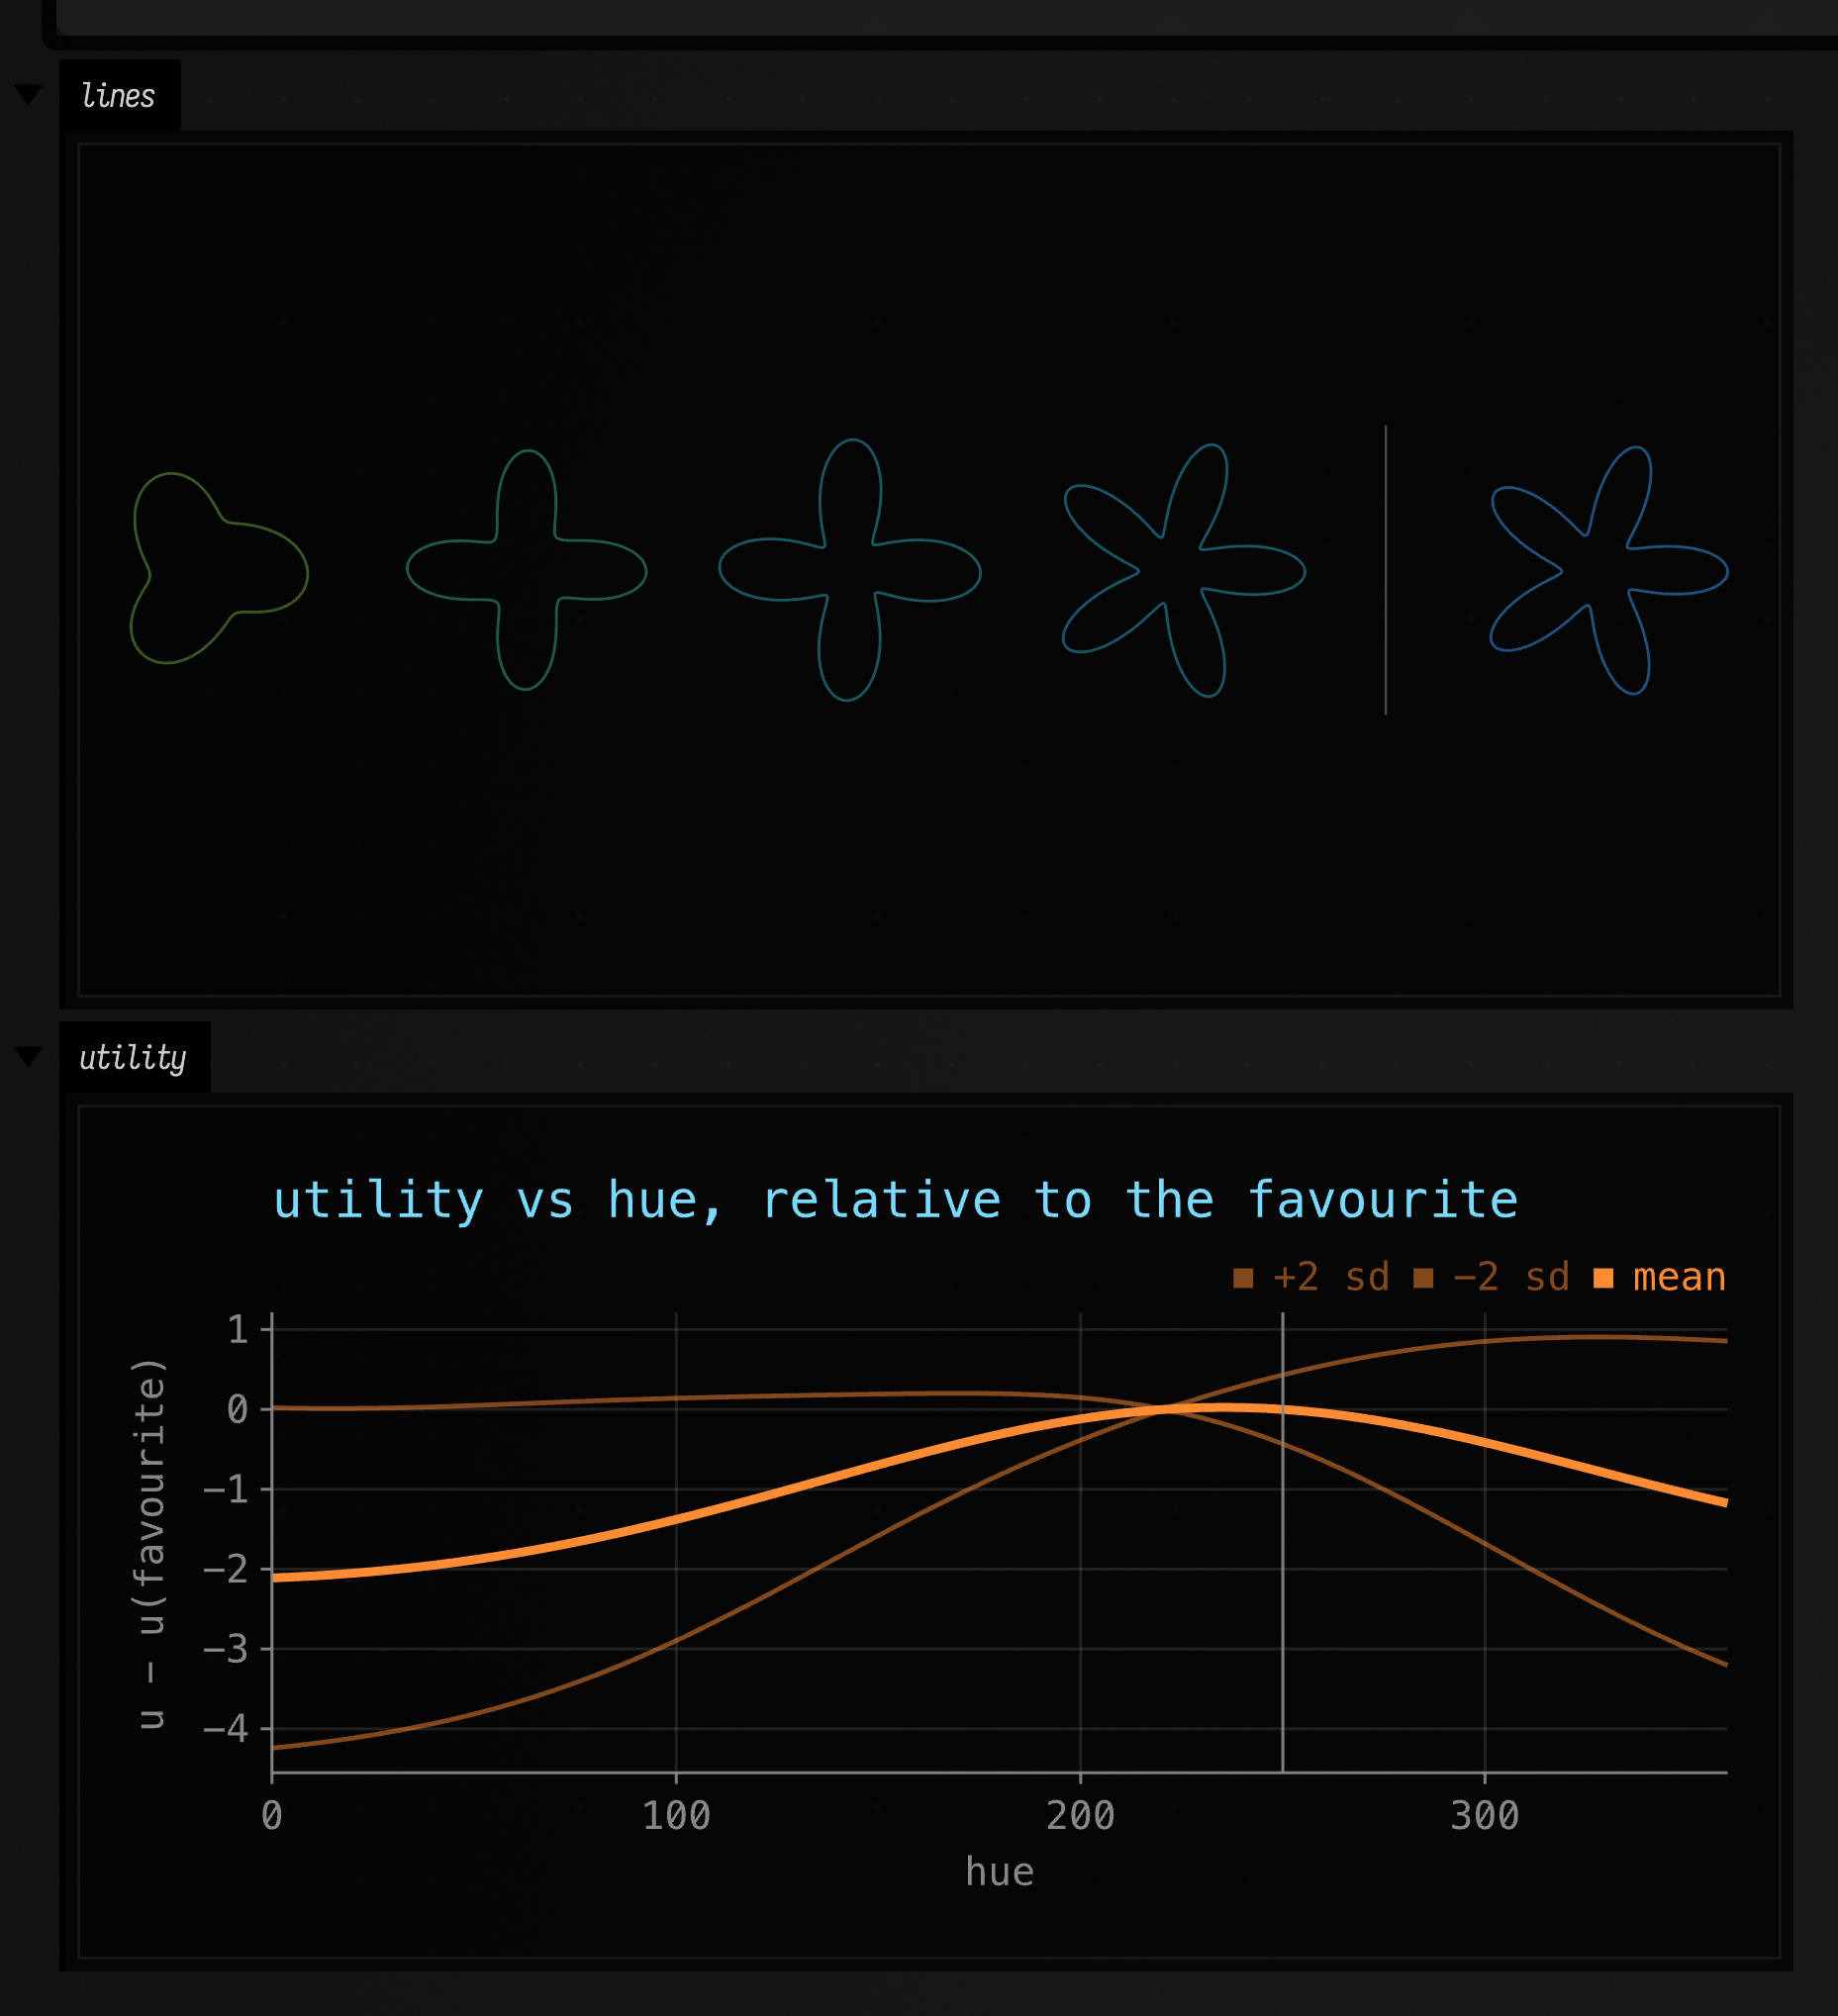
The printed utilities rise from -0.39 after six answers to -0.01 after twenty-four (the ideal
scores 0, and a random rosette about -0.65). In the chart, the thick line is how much more or
less the model thinks the judge likes each hue than the favourite's, with the other dials held
at the favourite's, and the thin lines are two standard deviations either side. The band is
pinched at the favourite and opens towards hues nobody was asked about. The chart uses
utilityRelativeTo(favourite, p) because the answers only ever say which of two is better: the
model learns differences, and the overall level of utility(p) stays as uncertain as before.
The scores are relative. A setting's utility(p) can be compared with another's, but its zero
means nothing.
noise(default 0.1) says how inconsistent your answers are allowed to be. A smaller value trusts each click more, and changes its mind more abruptly.lengthScale(default 0.25, in units of each range) says how far apart two settings must be before your opinion of one says little about the other.exploration(default 1.0) weighs promise against what is already known when choosing the challenger.
Answering the same pair both ways is fine: the two settings end up tied.
The demo
The gp_instruments document has three boxes. Box 1 tunes a curve to a
target with GpOptimizer and charts the best misfit after each try. Box 2 is the A/B loop
above, waiting for you to click. Box 3 runs the same loop with a simulated judge whose taste is
known, and draws the favourite after every six answers next to that judge's ideal.
How the two models work
GpOptimizer rescales every parameter to [0, 1] and standardises the scores. Its surrogate
is a Matérn-5/2 GP with one length scale per parameter, refitted with the noise by maximum
evidence after every observation. The acquisition function is maximised over random points
and jitters of the best observations, then refined by gradient ascent; the gradient is a
central difference, because expected improvement needs the gradient of the posterior
standard deviation and the GP library exposes only the gradient of the mean. Batches use the
"kriging believer": each chosen point is provisionally observed at the model's own mean.
GpPreference is the probit preference GP of Chu and Ghahramani (2005). The posterior over
the latent utility is replaced by its Laplace approximation, found by Newton's method. The
design notes are in dev_docs/GP_INSTRUMENTS.md.