Field Probes: instrumenting shaders
A compute shader that updates a million particles has no println and no stack
trace, so it is hard to tell what its numbers look like. Are the speeds finite?
Is anything NaN? What are the spread, the median and the tail?
Field has two probes for this. Each is a line in a shader that records a value, plus a setup call on the box that reads a summary of those values back. They differ in where the statistics are computed:
| Property | fieldProbe — CPU read-back probe |
fieldStats — GPU stats probe |
|---|---|---|
| Where stats are computed | exact aggregates on the GPU; histogram / mean / percentiles on the CPU from a sample | entirely on the GPU (parallel reduction) |
| What comes back to the CPU | a reservoir sample of raw values + exact min/max/counts | a handful of scalars per channel (optional) |
| Front-end output | a live histogram + summary card | numbers (you render them however you like) |
| Best for | seeing a distribution while you develop | feeding stats back into the shader, or many channels cheaply |
| Cost | a read-back per snapshot (throttled, off-thread) | one extra compute dispatch; read-back optional |
Both are wired the same way. Call one setup function on the box, add
{% property "…" %} to the shader, and call the recording function wherever the
value is in scope. Field resolves the include, allocates the buffers and reads
them back, so there are no descriptor sets or SSBOs to set up by hand.
The example throughout is a compute-shader particle system: a swirl of particles moved by a simple force field, drawn as soft quads. The value recorded is each particle's speed.
fieldProbe, the CPU read-back probe
fieldProbe is the one to use while developing. It samples values on the GPU,
pulls a representative sample back to the CPU, and shows a live card: a
histogram with summary figures above it, coloured by whether each rose or fell
since the last snapshot, as in the video below. First, the particle system it
instruments.
The particle system we instrument
The compute shader reads each particle from one buffer_reference buffer,
rotates and mixes its position by a slowly-advancing angle (something, driven
from Kotlin), and writes the result (keeping its size in .w) into a
second buffer. The vertex shader expands six vertices per particle into a
camera-facing quad; the fragment shader draws a soft dot. This is the ordinary
two-module (compute + draw) pattern from
Field 4 Graphics. The only probe-specific lines
are the include and the single fieldProbe(length(delta)) call, which records
how far each particle moved this step.
#version 450
#extension GL_EXT_buffer_reference : require
layout(local_size_x = 64) in;

layout(std430, buffer_reference) buffer inData {
    vec4 a[];
};
layout(std430, buffer_reference) buffer outData {
    vec4 a[];
};

layout(push_constant) uniform dat {
    inData inData;
    outData outData;
    float something; // a slowly-advancing angle, set from Kotlin
    uint particleCount; // valid entries; the final workgroup can include padding
} pc;

{% property "fieldProbe" %}

void main() {
    uint idx = gl_GlobalInvocationID.x;
    if (idx >= pc.particleCount) return;

    vec4 seed = pc.inData.a[idx];
    float phaseZ = pc.something * seed.z;
    float phaseW = pc.something * seed.w;
    // Only the y cosine uses the slow phase; the other three trigonometric terms do not.
    float slowPhaseZ = phaseZ * 0.03;
    vec2 moved = vec2(
    seed.x * cos(phaseZ) + seed.y * sin(phaseW),
    -seed.x * sin(phaseW) + seed.y * cos(slowPhaseZ)
    );
    pc.outData.a[idx] = vec4(moved, seed.zw); // Carry seed and size unchanged.

    // Distance moved this step, rather than distance per second.
    vec2 delta = moved - seed.xy;
    fieldProbe(length(delta)); // <-- the only instrumentation
}
The Kotlin that drives it lives in two boxes, a compute box and a draw
box, both children of a renderer box that owns the Window. The compute box
allocates the two GPU buffers, seeds one with random particles, publishes the
output buffer as outputPositions, and turns the probe on with
fieldProbeHere(...) and .display("probe"):
// --- compute box -------------------------------------------------
var module = computeModuleHere {}
var m = ComputeMesh()
module += "step" to m
renderer += "compute" to module

val N = 100000
var inData = defaultBuffer { size = N.vec4s }.buffer
var outData = defaultBuffer { size = N.vec4s }.buffer
m.inData = { inData }
m.outData = { outData }
var x = 0.0
m.particleCount = { N }
m.something = {
    x += 0.01
    x.f
} // the advancing angle

// Turn the CPU probe on: keep 4096 live samples and show the card.
fieldProbeHere(samples = 4096).display("probe")
displayOpen("probe") // start the card expanded, not collapsed

prop<FrameBufferGroup>(outputPositions) = outData // publish for the draw box
m.x = (N + 63) / 64
m.y = 1
m.z = 1
inData.write { for (i in 0 until N) put(vec(Math.random(), Math.random(), Math.random(), Math.random())) }
// --- draw box (child of the compute box) -------------------------
var module = moduleHere { primitiveType = triangles }
var m = Mesh()
module += "mesh" to m
renderer += "draw" to module
val N = 100000
m.inData = {
outputPositions
} // read the published buffer
m.aspectRatio = { window.width / window.height.toFloat() }
m.set(N * 2 * 3, 0) {}Launched together, the three boxes draw a slowly-turning galaxy of 100 000 soft quads:
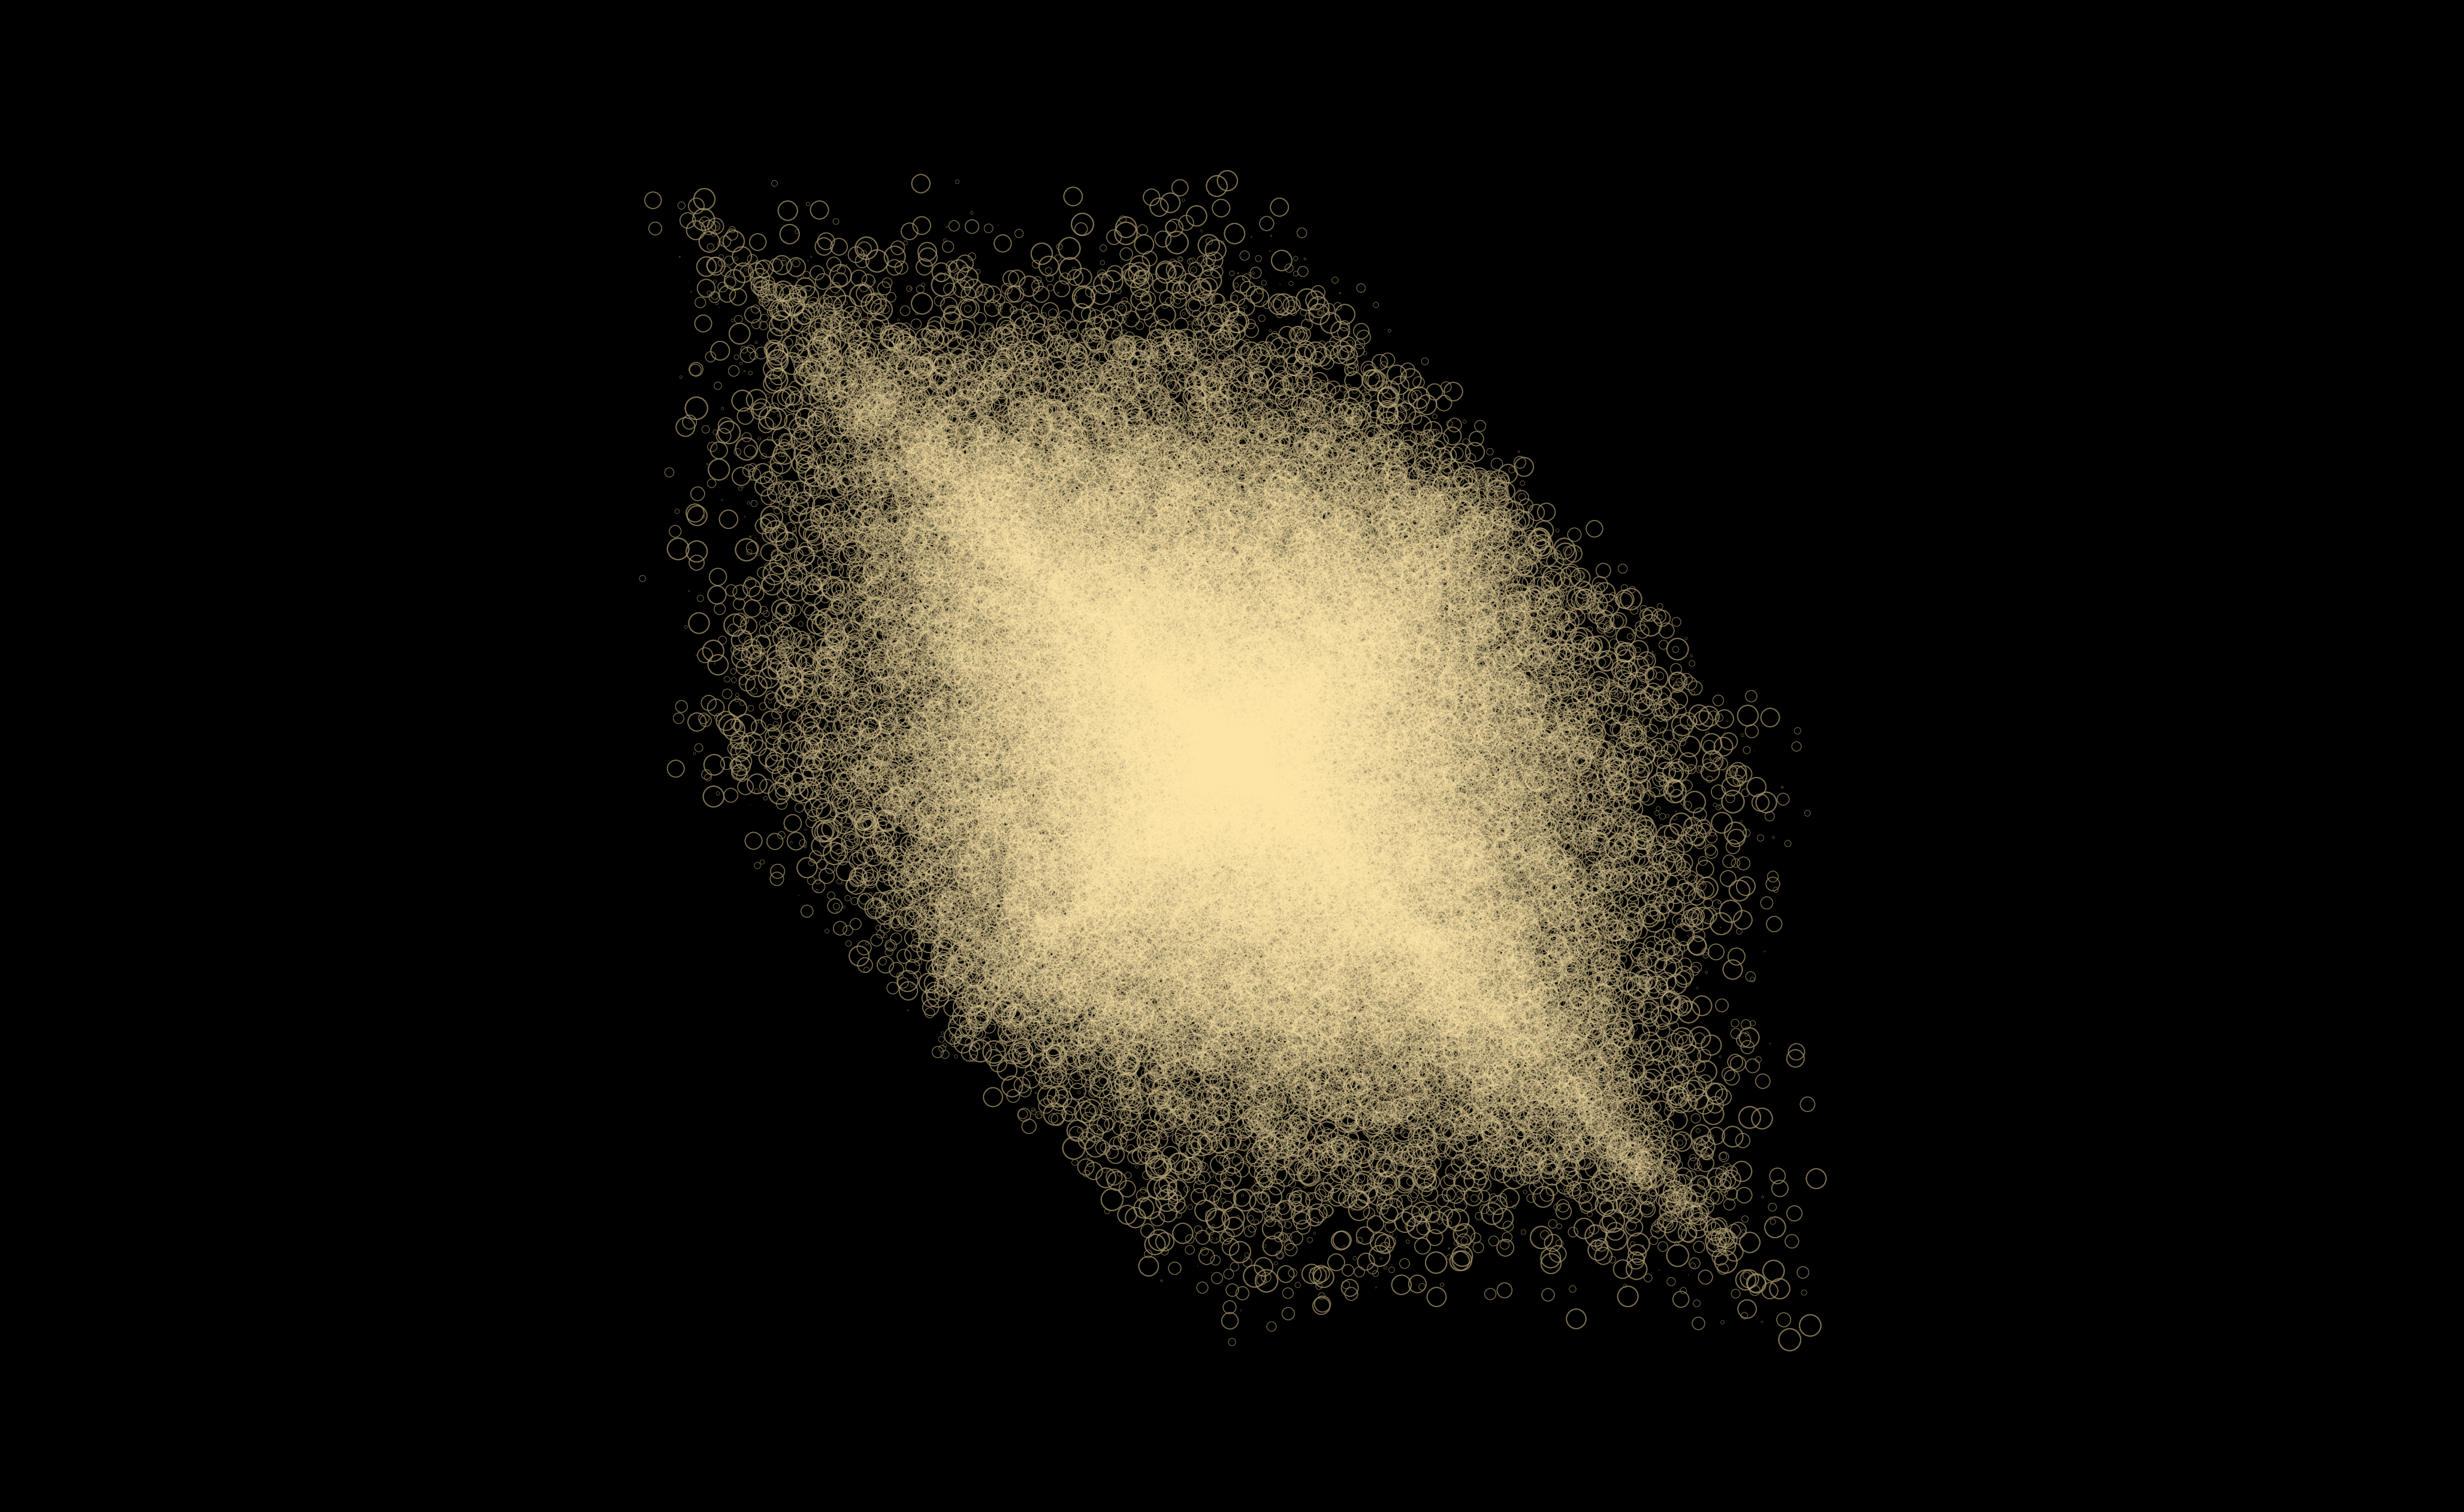
The picture does not show what the particle speeds are. The probe's card, on
the compute box's probe channel, does. ShaderFieldProbe.maxDisplayHz limits
it to 5 updates a second by default, rather than one per rendered frame:
GLSL side
Add the include once, then call fieldProbe(...) wherever the value is in scope.
The include defines overloads for scalars, vectors, and their integer forms:
{% property "fieldProbe" %}

void fieldProbe(float value);
void fieldProbe(int value);
void fieldProbe(uint value);
void fieldProbe(vec2 value);
void fieldProbe(vec3 value);
void fieldProbe(vec4 value);
void fieldProbe(ivec2 value);
void fieldProbe(ivec3 value);
void fieldProbe(ivec4 value);
void fieldProbe(uvec2 value);
void fieldProbe(uvec3 value);
void fieldProbe(uvec4 value);
Each call keeps exact, lock-free counts in one std430
buffer: it increments an invocation counter, tracks accepted / finite / NaN / Inf /
non-zero counts, and folds per-component min and max with atomicMin / atomicMax
over an order-preserving uint encoding of the float. Raw values are captured by
reservoir sampling (a hash of the invocation ordinal decides which slot to
overwrite once the reservoir is full), so the CPU receives an unbiased sample of
the whole population rather than just the first N invocations. The first probed
type wins for the frame; mixing fieldProbe(float) and fieldProbe(vec3) in the
same pass is counted as a type mismatch rather than silently averaged.
Kotlin side
Box.fieldProbeHere(...) creates (or reuses) the probe on the box and returns it
for further configuration:
fun Box.fieldProbeHere(
    samples: Int = 1024, // reservoir size pulled back to the CPU
    binding: Int = 63, // SSBO binding for FieldProbeBuffer
    descriptorSet: Int = 0,
    enabled: Boolean = true,
    ordinalRange: UIntRange? = null, // probe only a slice of invocations
): ShaderFieldProbe
The returned ShaderFieldProbe has chained setters and a few controls:
val probe = fieldProbeHere(samples = 4096).display("probe")

// tuning knobs
probe.maxDisplayHz = 12.0 // throttle card refreshes (default 5 Hz)
probe.ordinalRange(0u until 1000u) // restrict which invocations are sampled
probe.configure(samples = 256) // reconfigure live

// When finished: probe.deregister()    // stop and close the display channel

// pull the latest result without a display channel
val snap: FieldProbeSnapshot? = probe.readLatest()

// Optional alternative to polling: receive each snapshot on the read-back thread.
// probe.onSnapshot { snapshot -> println(snapshot.scalarSummary()) }
display(channel) pushes the rendered HTML card to that output channel on the
box; onSnapshot { } hands you the raw FieldProbeSnapshot on the read-back
thread if you would rather build your own UI or drive control logic. Read-back
always happens off the render thread, so a slow front end never stalls the GPU.
maxDisplayHz limits how often the card is sent. maxReadHz limits the
GPU-to-CPU read for every kind of probe; left unset, a display-only probe reads at
maxDisplayHz and one with onSnapshot or readLatest() reads every frame.
The snapshot
Every read-back produces an immutable FieldProbeSnapshot. The counts and
exactMin / exactMax are exact GPU aggregates over all invocations; the
percentiles, histogram, and summary are computed on the CPU from the reservoir
sample:
data class FieldProbeSnapshot(
    val dimensions: Int, // 1=scalar, 2=vec2, 3=vec3, 4=vec4
    val invocationCount: Long, // total fieldProbe(...) calls
    val acceptedCount: Long, // within ordinalRange and matching type
    val finiteCount: Long, // non-NaN, non-Inf
    val sampleCount: Int, // reservoir samples actually returned
    val nanCount: Long,
    val infCount: Long,
    val nonZeroCount: Long,
    val typeMismatchCount: Long,
    val exactMin: DoubleArray, // per component, exact over all invocations
    val exactMax: DoubleArray,
    val samples: List<Vec4>,
)

// derived, on demand:
snap.anyNaN
snap.anyInf
snap.anyNonZero
snap.percentile(0.95) // from the sample
snap.scalarValues()
snap.scalarSummary()
snap.vec3Summary()
snap.summaryHtml(previous = last) // the card (histogram + chips)
summaryHtml(previous) is what display(...) calls internally; passing the
previous snapshot is what colours each figure by whether it rose or fell.
fieldStats, the GPU stats probe
fieldStats computes the statistics on the GPU and never brings raw samples
back. Each recording call combines values across its subgroup, and a follow-up
compute pass combines those partial results into exact per-channel statistics
(count, mean, variance, min, max, sum) plus a t-digest-style quantile sketch.
The results stay in a buffer that other shaders can read, which the CPU probe
cannot offer: a shader can react to the statistics without a trip through the
CPU.
Kotlin side
fun Box.fieldStatsHere(
    channels: Int = 1, // independent distributions (1..64)
    sketchSize: Int = 256, // quantile-sketch resolution (pow2, 16..256)
    maxPartials: Int = 65_536,
    descriptorSet: Int = 0,
    partialBinding: Int = 61,
    resultBinding: Int = 62,
    stateSlots: Int = 8, // GPU-side smoothed/EMA slots
): ShaderFieldStats
Read results back on the CPU per channel, or don't, if only the shader consumes
them (set stats.cpuSnapshotsEnabled = false to skip the read-back entirely):
val stats = fieldStatsHere(channels = 1)
// ... run the dispatch ...

val s = stats.read(0) // blocking exact read of channel 0

s.mean
s.standardDeviation
s.min
s.max
s.finiteCount
s.quantile(0.5) // median from the GPU sketch
s.cdf(1.0) // fraction of samples <= 1.0

// Alternative: use the most recent asynchronous snapshot when one is available.
stats.latest(0)?.let { recent ->
    println("Latest async mean: ${recent.mean}")
}
data class FieldScalarStatsSnapshot(
val calls: Long,
val finiteCount: Long,
val invalidCount: Long,
val nonZeroCount: Long,
val min: Double,
val max: Double,
val mean: Double,
val variance: Double,
val sum: Double,
val sumSquares: Double,
val standardDeviation: Double,
val droppedPartials: Long, // >0 means raise maxPartials
val centroids: List<Pair<Double, Double>>, // (value, weight) sketch
) {
fun quantile(q: Double): Double
fun cdf(value: Double): Double
}GLSL side: recording
The include adds the recorder. One shader invocation per particle calls it; the helper combines values across the subgroup and writes one partial record per subgroup, which keeps atomic operations few:
{% property "fieldStats" %}

void fieldStatsRecord(uint channel, float value);
void fieldStatsRecord(int channel, float value);
void fieldStatsRecordVec4(uint firstChannel, vec4 value); // 4 consecutive channels
// in main(), after computing the new velocity:
fieldStatsRecord(0u, length(vel));GLSL side: reading on the GPU
The same include, in any shader, also has query helpers that read the results of the previous frame. This is how a statistic feeds back into rendering: for example, colouring each particle by its speed relative to the live median, with no trip through the CPU:
FieldScalarStats fieldStatsRead(uint channel); // .mean .min .max .finiteCount ...
float fieldStatsQuantile(uint channel, float q); // e.g. median = q 0.5
float fieldStatsCdf(uint channel, float value);
float fieldStatsSmoothedMean(uint slot, uint channel, float halfLife);
float fieldStatsSmoothedQuantile(uint slot, uint channel, float q, float halfLife);
fieldStatsSmoothedMean and fieldStatsSmoothedQuantile use the GPU-side
state slots (stateSlots) to keep an exponentially-smoothed value across frames (a
halfLife in frames), so a statistic that feeds back into the sim does not
flicker frame to frame.
A shader in a different box from the one recording, which only reads the stats, binds them as a consumer with useFieldStats:
val stats = producerBox.fieldStatsHere(channels = 1)
consumerBox.useFieldStats(stats) // include "fieldStats" now resolves as a reader
Reading it back on the CPU
If you do want the numbers in Kotlin (for logging, tests, or a custom readout),
the read-back is a few numbers per channel, not an array of samples.
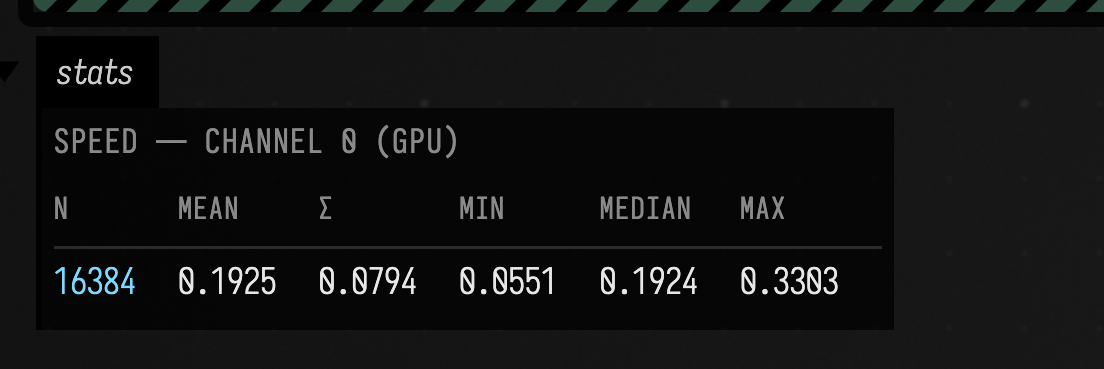
The box below runs a compute step under fieldStats and shows channel 0 as a table.
Put this shader in the box's compute property before running its Kotlin. It uses its
own position and velocity buffers, and records each particle's speed in world units per second:
#version 450
#extension GL_EXT_buffer_reference : require
layout(local_size_x = 64) in;
layout(std430, buffer_reference) buffer Positions {
    vec4 a[];
};
layout(std430, buffer_reference) buffer Velocities {
    vec4 a[];
};
layout(push_constant) uniform Step {
    Positions positions;
    Velocities velocities;
    float dt; // seconds per step
    uint particleCount;
} pc;
{% property "fieldStats" %}

void main() {
    uint i = gl_GlobalInvocationID.x;
    if (i >= pc.particleCount) return;
    vec4 p = pc.positions.a[i];
    vec3 acceleration = vec3(-p.y, p.x, 0.0) * 0.15 - p.xyz * 0.03;
    vec3 velocity = (pc.velocities.a[i].xyz + acceleration * pc.dt) * 0.995;
    pc.positions.a[i] = vec4(p.xyz + velocity * pc.dt, p.w);
    pc.velocities.a[i] = vec4(velocity, 0.0);
    fieldStatsRecord(0u, length(velocity));
}
// Requires the matching compute property above and an inherited renderer.
val N = 16384
val stats = fieldStatsHere(channels = 1)
val positions = defaultBuffer { size = N.vec4s }.buffer
val velocities = defaultBuffer { size = N.vec4s }.buffer
positions.write {
for (i in 0 until N) {
val a = Math.random() * Math.PI * 2.0
val r = 0.15 + 0.75 * Math.random()
put(vec(Math.cos(a) * r, Math.sin(a) * r, 0.0, 1.0))
}
}
velocities.write { for (i in 0 until N) put(vec(0.0, 0.0, 0.0, 0.0)) }
val compute = computeModuleHere {}
val step = ComputeMesh()
compute += "step" to step
renderer += "compute" to compute
// Reflected push-constant members resolve once the mesh is attached to its module.
step.positions = { positions }
step.velocities = { velocities }
step.dt = { 0.016f }
step.particleCount = { N }
step.x = (N + 63) / 64
step.y = 1
step.z = 1
// show the GPU-computed aggregates as a small table
frames {
while (true) {
stats.latest(0)?.let { s ->
:::fold render the aggregates as a small table
markdown(
"stats",
"""
#### speed — channel 0 (GPU)
| n | mean | σ | min | median | max |
|---|------|---|-----|--------|-----|
| ${s.finiteCount} | ${s.mean.f4} | ${s.standardDeviation.f4} | ${s.min.f4} | ${s.quantile(0.5).f4} | ${s.max.f4} |
""",
)
:::endfold
}
frame()
}
}
Choosing between them
- Use
fieldProbeto see what a shader is producing. The histogram shows an unfamiliar distribution at a glance, and because it is drawn from a sample you see its shape (skew, modes, outliers), not only its mean and spread. - Use
fieldStatswhen the statistic has a job to do: feeding back into a shader, driving adaptive control, or watching many channels where pulling samples back for each would be wasteful. Its read-back is cheap enough to leave on, and can be turned off entirely.
They work together. A common pattern is to keep fieldStats on permanently for the
control loop and switch on fieldProbe only while you are looking.
Performance notes
- Read-back memory. Both probes' read-back buffers are allocated as
host-cached (
streamReads()), which is the memory type CPU reads want on a discrete GPU. A host-visible-but-uncached (write-combined) buffer maps fine but its CPU reads are very slow. If you build your own read-back buffer, ask for the same:storage(); streamReads(). - Throttling.
fieldProbereads back off the render thread, at mostmaxReadHztimes a second when that is set, elsemaxDisplayHzwhen it only has adisplay(...)channel; raising it updates the card more often at the cost of more read-backs.fieldStatsreads back once per frame whencpuSnapshotsEnabledis true; set it tofalsewhen only the GPU consumes the results. - Reservoir size.
fieldProbe'ssamplesis the number ofvec4s copied back per snapshot. A few thousand is plenty for a histogram; there is no benefit to sampling the whole population. - Dropped partials. If
fieldStatsreportsdroppedPartials > 0, its partial buffer overflowed; raisemaxPartials.