Graphs that change while you watch
Watch points move and connect to their neighbours. As they travel, new edges appear, familiar connections grow stronger, and old ones fade. The graph remembers where the points have been near each other, then slowly forgets.
Three things work differently from a static graph:
- An edge is a weight with a lifetime.
DynamicEdgeListstoresweight,age,ttlandflagsper edge, and aDynamicGraphSystemonly ever adds. Itsreinforcesaturates at a ceiling, and removal is a separate step:decayLinearordecayExponential, which bleed weight, count down ttl, and drop whatever reaches zero. A structure therefore persists exactly as long as something keeps proposing it. - The neighbour query is rebuilt every frame, because the cloud has moved. That is what
Vec3SpatialHashis for, andstepDynamicGraphandDynamicProcessPipelinerebuild it for you. - The population is a variable. A
DynamicPointProcessmoves points, spawns them and removes them, so the number of points changes as the run goes.
Six ways to propose an edge
Field has six DynamicGraphSystems, and they differ in what an edge means. The example runs all
six over the same disc of points, for the same number of frames and under the same edge-weight
ceiling. Reinforcement is not shared: routing reinforces by 1.0, the other update laws by 4.0, and
the alpha-event system per unit area, so compare the panels by the shape of their edges rather than
their total weight.
:::static
/*
Six systems share a cloud, step count and edge-weight ceiling. Reinforcement is
system-specific: routing uses 1.0, the other update laws use 4.0, and alpha scales
reinforcement per unit area. These are not equal reinforcement budgets.
*/
val cloud =
    List(220) { i ->
        val a = i * 2.39996322972865332
        val r = 0.5 * Math.sqrt((i + 0.5) / 220.0)
        Vec3((r * Math.cos(a)).toFloat(), (r * Math.sin(a)).toFloat(), 0f)
    }
val window = dynamicGraphWindow(cloud, padFraction = 0.06)
val ceiling = 4.0

fun build(system: DynamicGraphSystem): Pair<DynamicPointState, DynamicEdgeList> {
    val state = DynamicPointState(cloud.map { Vec3(it) }.toMutableList())
    val edges = DynamicEdgeList(state.pointCount)
    val hash = Vec3SpatialHash(0.06)
    repeat(20) { stepDynamicGraph(1f / 60f, state, edges, hash, system) }
    return state to edges
}

val systems = listOf<Pair<String, DynamicGraphSystem>>(
    "kNN k=5" to
        Vec3BreathingAnisotropicKnnSystem(
            k = 5,
            ttl = 10f,
            reinforce = 4.0,
            maxWeight = ceiling,
            mutualOnly = true,
            queryRadius = 0.12,
        ),
    "flowline" to
        Vec3FlowlineAdvectionGraphSystem(
            influenceRadius = 0.10,
            stepLength = 0.08,
            ttl = 10f,
            reinforce = 4.0,
            maxWeight = ceiling,
        ),
    "tangent fan" to
        Vec3LocalTangentTriangulationSystem(
            neighborhoodK = 6,
            ttl = 10f,
            reinforce = 4.0,
            maxWeight = ceiling,
            maxNeighborRadius = 0.10,
        ),
    "hysteresis" to
        Vec3PersistentProximityHysteresisSystem(
            rEnter = 0.055,
            rExit = 0.075,
            ttl = 10f,
            reinforce = 4.0,
            maxWeight = ceiling,
        ),
    "routing, 1 arc" to
        Vec3SignalRoutingGraphSystem(
            neighborhoodK = 6,
            ttl = 10f,
            reinforce = 1.0,
            maxWeight = ceiling,
            routeCount = 1,
            maxNeighborRadius = 0.10,
        ),
    "alpha-event" to
        Vec3AlphaEventHypergraphCollapseSystem(
            neighborhoodK = 6,
            alphaRadius = 0.075,
            ttl = 10f,
            reinforcePerUnitArea = 4.0,
            maxWeight = ceiling,
            maxNeighborRadius = 0.09,
            minArea = 1e-4,
        ),
)

// For each panel: how many edges, what fraction of them close a triangle, and how much of the shared
// weight ceiling the system's weights reached (colour and thickness are on one fixed scale).
val panels = systems.map { (name, system) ->
    val (state, edges) = build(system)
    val adjacency = Array(state.pointCount) { HashSet<Int>() }
    for (e in edges.values()) {
        adjacency[e.i].add(e.j)
        adjacency[e.j].add(e.i)
    }
    val closed = edges.values().count { e -> adjacency[e.i].any { it != e.j && adjacency[e.j].contains(it) } }
    val fraction = if (edges.values().isEmpty()) 0.0 else closed.toDouble() / edges.values().size
    val wmax = edges.values().maxOfOrNull { it.weight } ?: 0.0
    println(
        "%-16s %4d edges  %5.1f%% in a triangle  mean degree %.2f  wmax %.4f (%.1f%% of ceiling)"
            .format(
                name,
                edges.values().size,
                100.0 * fraction,
                2.0 * edges.values().size / state.pointCount,
                wmax,
                100.0 * wmax / ceiling,
            ),
    )
    // One FLine per edge, drawn as vector graphics. Weight sets both colour and stroke width,
    // against `ceiling`. A weight near zero starts 40% up the ramp, so the low-weight systems stay
    // visible on the dark card.
    "%s: %de %d%%tri".format(name, edges.values().size, Math.round(100.0 * fraction)) to
        dynamicGraphFLines(state.points, edges.values(), maxWeight = ceiling, colormap = "magma", minEdgeIntensity = 0.4)
}

// One shared window for all six panels, so nothing but the topology differs between them.
showPlaneGrid(
    *panels.toTypedArray(),
    columns = 3,
    cellWidth = 400,
    cellHeight = 400,
    window = dynamicGraphPlaneWindow(window),
)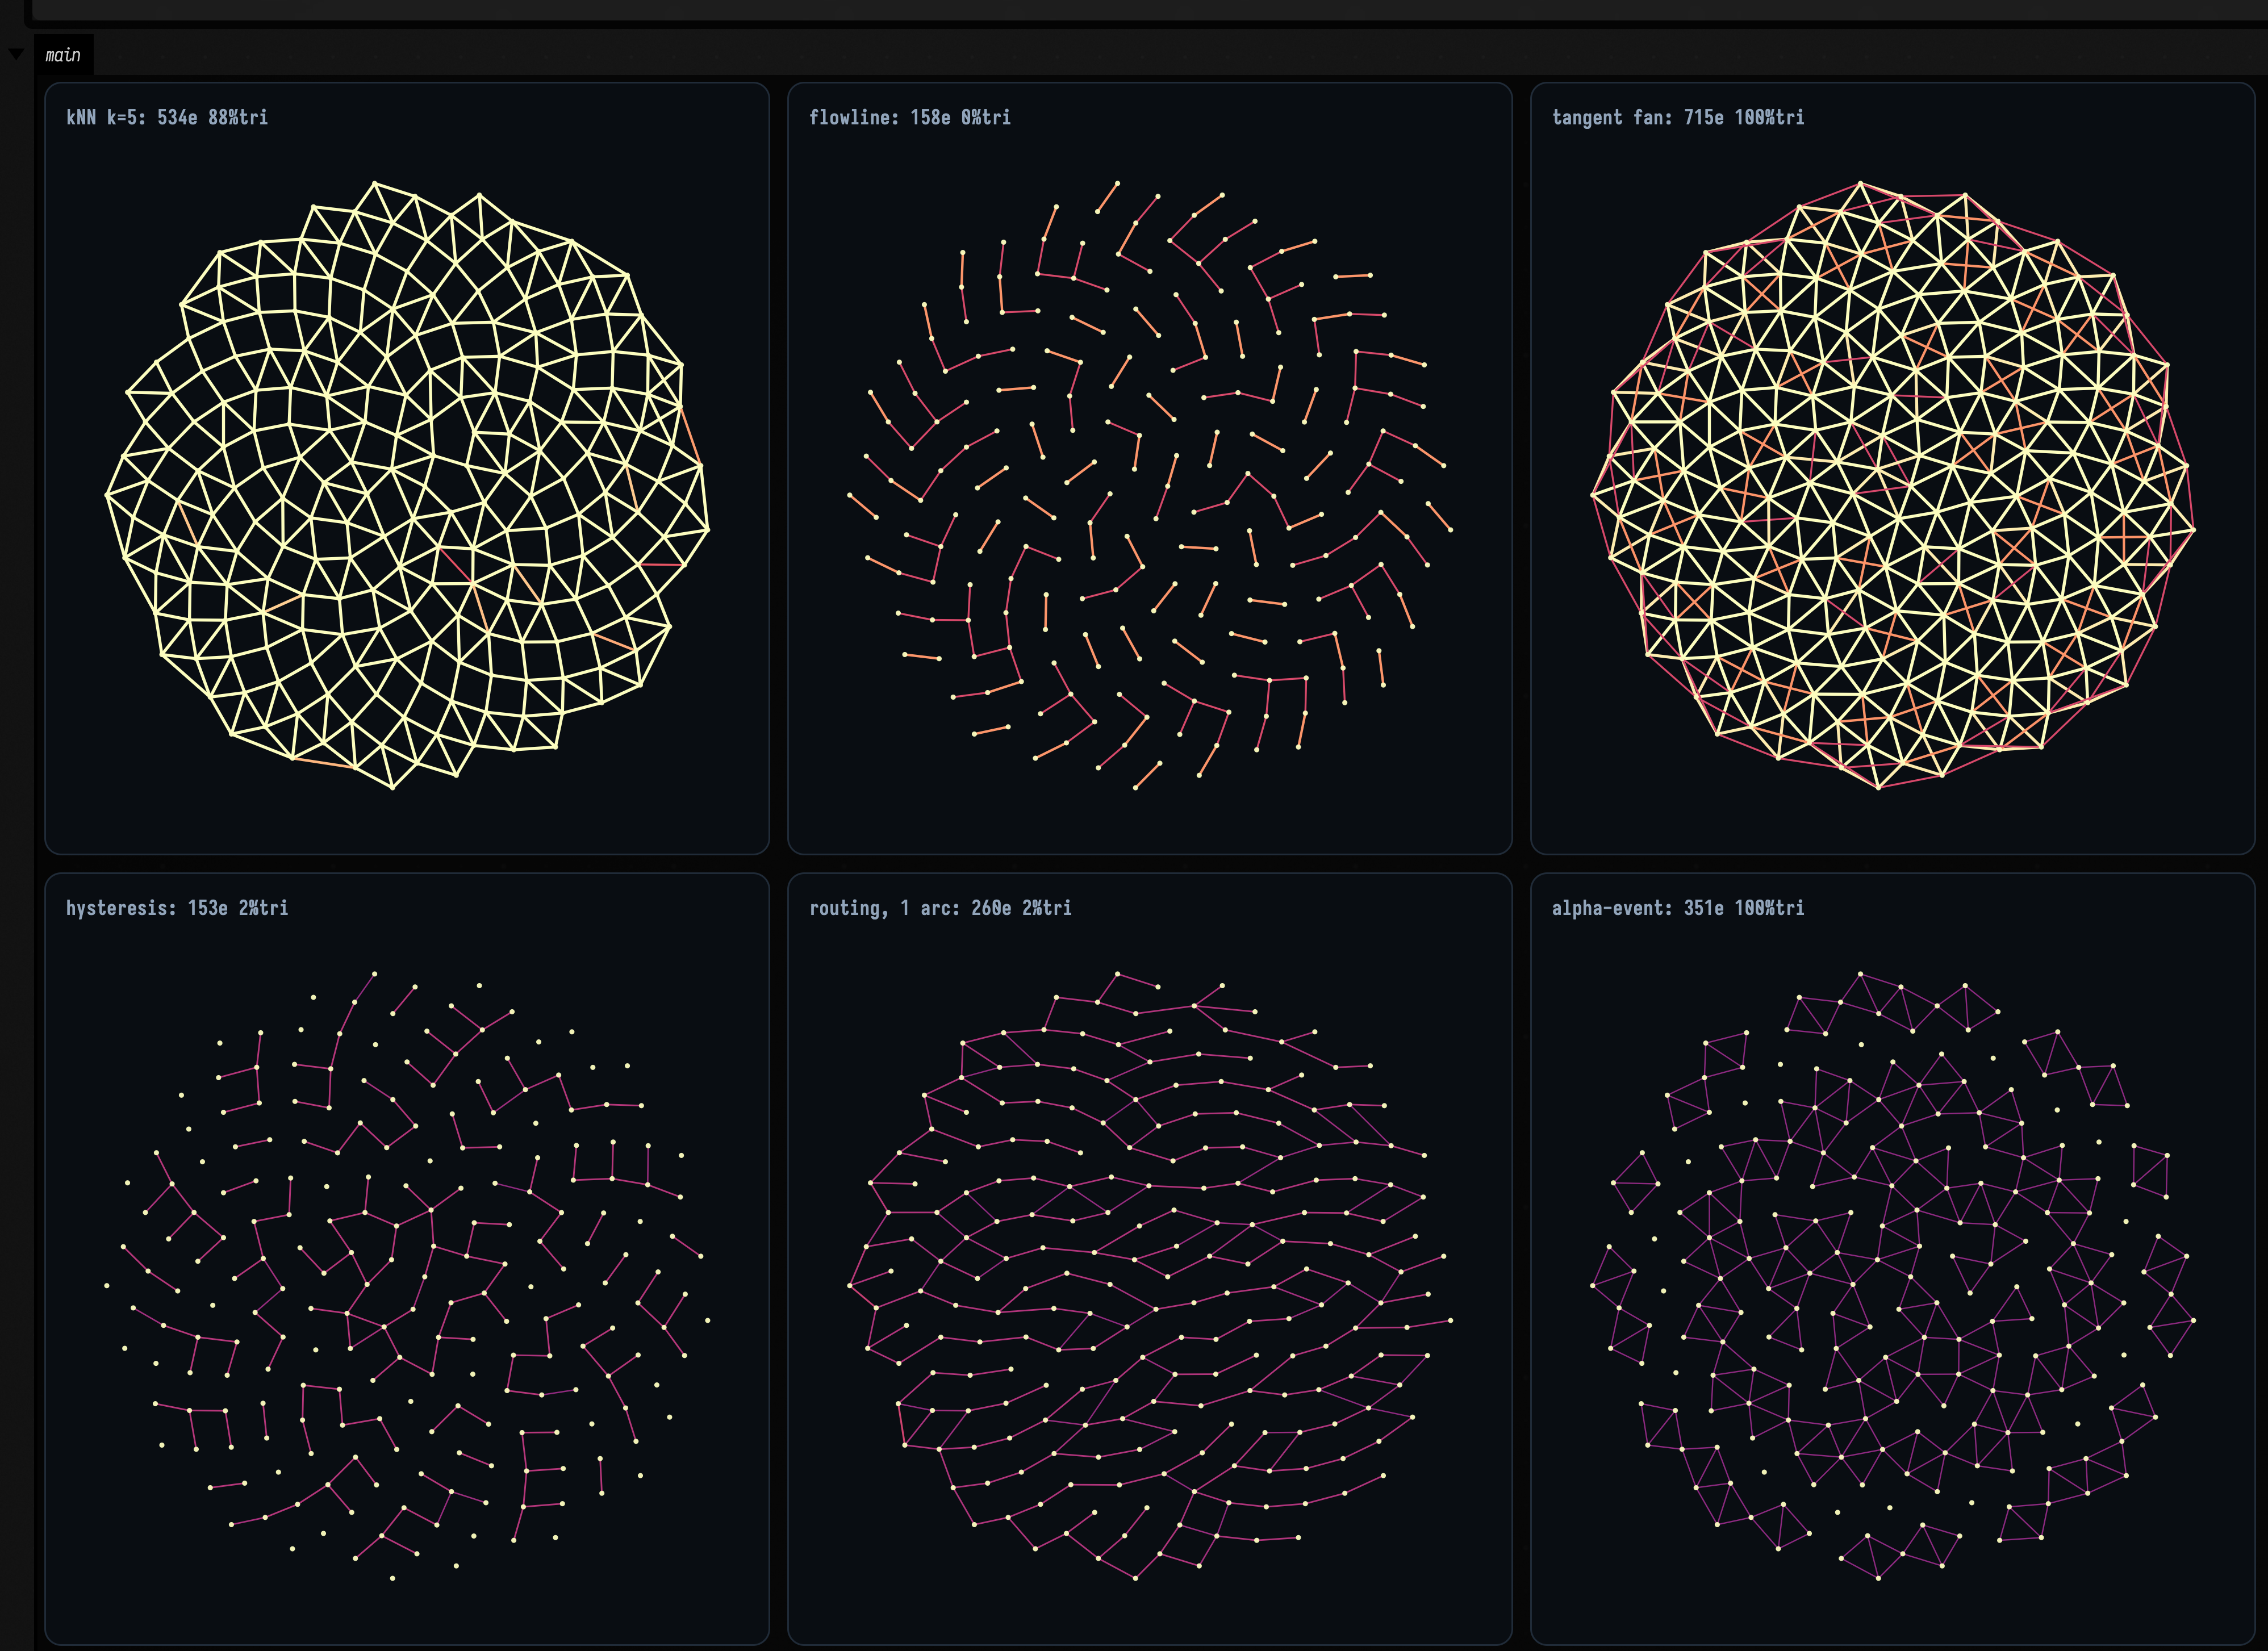
dynamicGraphFLines makes one FLine per edge, and showPlaneGrid draws them as SVG. Each edge's
colour and stroke width come from its weight as a fraction of the shared ceiling, on the same scale in
every panel, so a purple, thin panel is a system whose weights stayed low. A weight of zero starts
40 % up the ramp, so even the faintest edges show. The table gives the numbers
behind the panels:
| system | edges | in a triangle | mean degree | max weight reached |
|---|---|---|---|---|
mutual kNN, k = 5 |
534 | 88.4 % | 4.85 | 4.0000 — the ceiling |
| flowline advection | 158 | 0.0 % | 1.44 | 2.5346 (63 %) |
| local tangent fan | 715 | 100.0 % | 6.50 | 4.0000 — the ceiling |
| proximity hysteresis | 153 | 2.0 % | 1.39 | 0.6653 (17 %) |
| signal routing, 1 arc | 260 | 2.3 % | 2.36 | 1.0991 (27 %) |
| alpha-event triangles | 351 | 100.0 % | 3.19 | 0.0137 (0.3 %) |
The local tangent fan and alpha-event collapse put every edge in a triangle, because both build faces. The tangent fan fits a plane to each neighbourhood and joins consecutive neighbours by angle; alpha-event collapse strengthens all three sides of every small triangle. Flowline advection puts no edge in a triangle: it moves each point one step along a field and joins it to the point it lands nearest, so each point has one edge going out. The pinwheel in the top-middle panel is the spiral the points were laid out on.
Alpha-event weights scale with area
The alpha-event system's parameter is reinforcePerUnitArea, not reinforce: each increment is
multiplied by min(1, area). Triangles in a small cloud have tiny areas, so its edges stay faint.
Give it about a hundred times the reinforcement of the other systems to bring its edges level
with theirs.
Strengthening and forgetting
Decay is what makes these graphs remember. decayExponential(dt, λ) multiplies each weight by
\( e^{-\lambda\,dt} \), so the weight after a given time does not depend on how many frames it took.
decayLinear(dt, rate) subtracts rate × dt instead. The example steps one edge under each law
and plots both curves.
:::static
// One edge under each decay law, starting at weight 1, stepped at 60 frames a second for four seconds.
val exponential = DynamicEdgeList(2)
val linear = DynamicEdgeList(2)
exponential.reinforce(0, 1, 1.0, ttl = 1000f, maxWeight = 1.0)
linear.reinforce(0, 1, 1.0, ttl = 1000f, maxWeight = 1.0)

val expo = mutableListOf<Double>()
val lin = mutableListOf<Double>()
repeat(240) {
    expo += exponential.get(0, 1)?.weight ?: 0.0
    lin += linear.get(0, 1)?.weight ?: 0.0
    exponential.decayExponential(1f / 60f, 0.35)
    linear.decayLinear(1f / 60f, 0.35)
}

showSignals(
    "exponential, λ = 0.35" to expo,
    "linear, 0.35 / s" to lin,
    x = List(240) { it / 60.0 },
)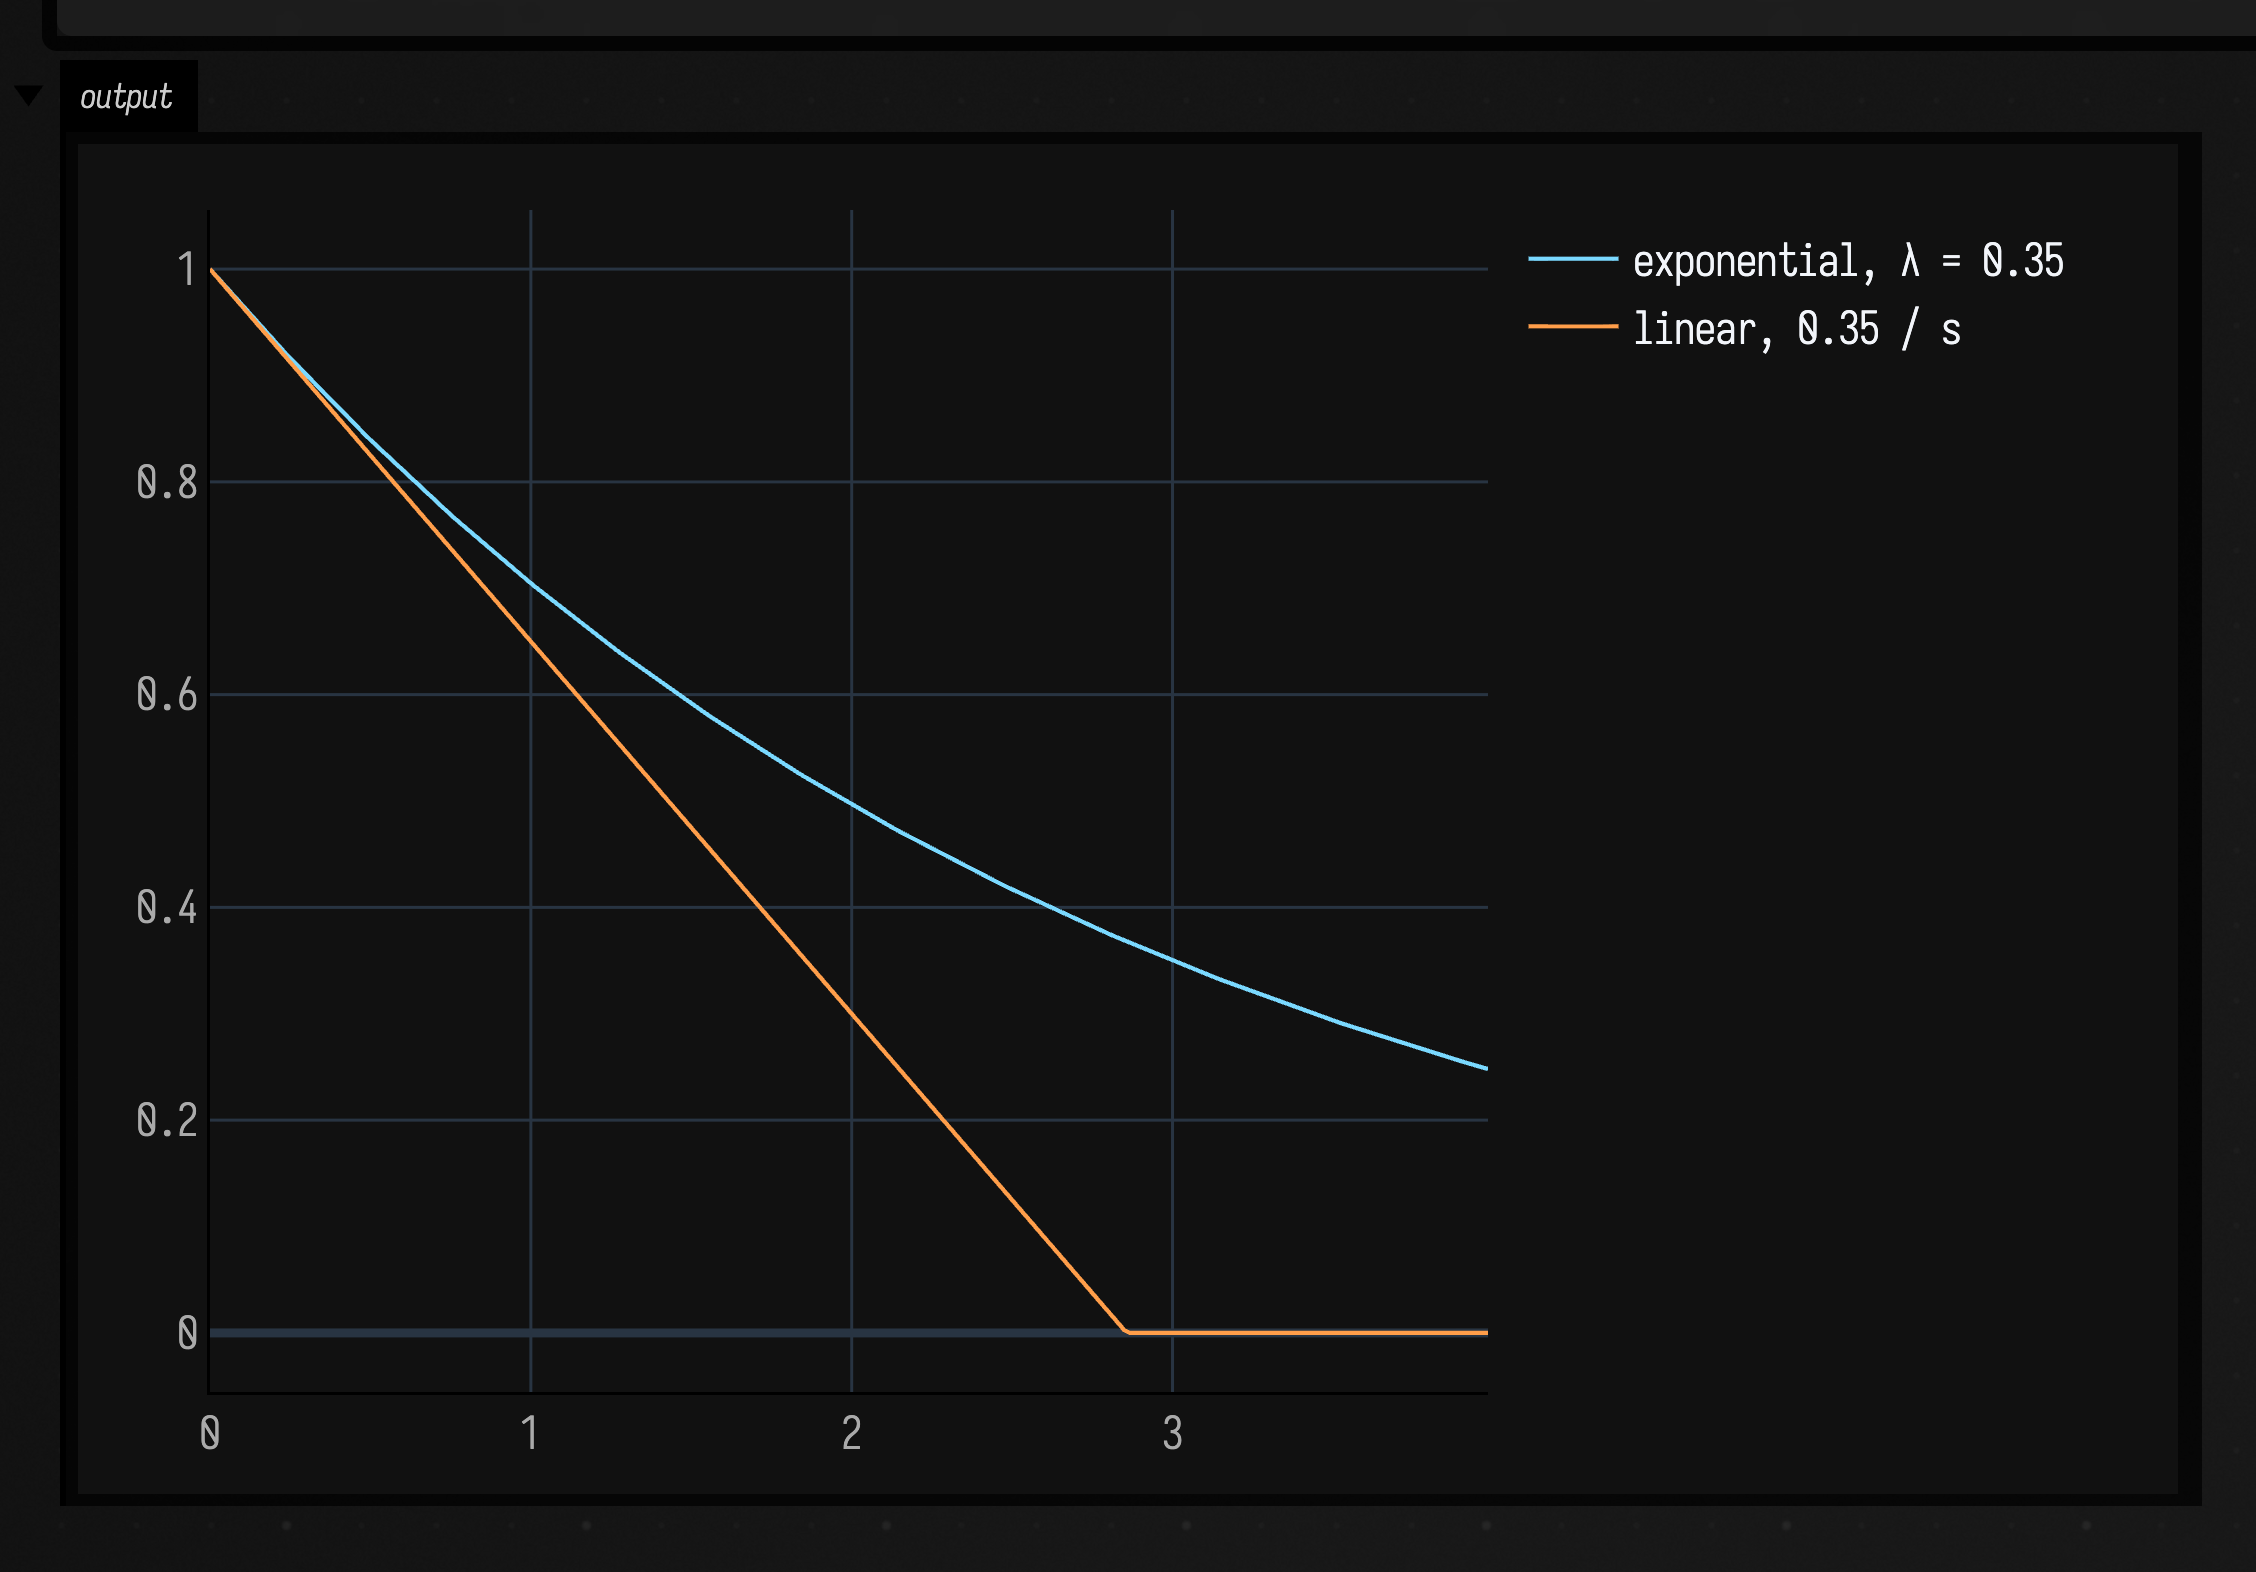
The two laws give different memories. Under exponential decay a weight halves every \( \ln 2 / \lambda \)
seconds and approaches zero. Under linear decay it reaches zero at a fixed time, and the edge is
removed then. ttl is separate from both: an edge expires when its ttl runs out, whatever its
weight, so an edge that keeps being proposed at the ceiling still dies eventually.
Hysteresis: keeping edges that already exist
Five of the six systems look only at where the points are.
Vec3PersistentProximityHysteresisSystem also looks at the edges it already has: a pair not yet
joined must come within rEnter, but a pair already joined only has to stay within rExit. An edge
formed while two points were close survives them drifting a little apart, so a cloud that jitters
across the threshold does not make the graph flicker.
The example runs a wobbling cloud twice: once with hysteresis, and once with rExit == rEnter,
which switches it off. A fold underneath does the same with two points walked apart.
:::static
// A 200-point disc, each point wobbling by up to 0.012 a frame: about a fifth of rEnter, enough to
// cross the threshold without rearranging the neighbourhood.
val n = 200
val base =
    List(n) { i ->
        val a = i * 2.39996322972865332
        val r = 0.45 * Math.sqrt((i + 0.5) / n)
        Vec3((r * Math.cos(a)).toFloat(), (r * Math.sin(a)).toFloat(), 0f)
    }
// Both panels share one window, computed from the cloud at rest, so they are drawn at the same scale.
val window = dynamicGraphWindow(base, padFraction = 0.06)

class Flicker(val appeared: Int, val vanished: Int, val standing: Int, val lines: List<FLine>)

// Run the cloud for 150 frames and count the edges created and lost along the way.
fun flicker(rExit: Double): Flicker {
    val state = DynamicPointState(base.map { Vec3(it) }.toMutableList())
    val edges = DynamicEdgeList(n)
    val hash = Vec3SpatialHash(0.06)
    val system = Vec3PersistentProximityHysteresisSystem(
        rEnter = 0.055,
        rExit = rExit,
        ttl = 0.35f,
        reinforce = 3.0,
        maxWeight = 3.0,
    )
    var appeared = 0
    var vanished = 0
    var present = HashSet<Pair<Int, Int>>()
    repeat(150) { frame ->
        for (i in 0 until n) {
            val phase = 0.31 * i + 0.16 * frame
            state.points[i] =
                Vec3(base[i])
                    .add(
                        vec(0.012 * Math.cos(phase), 0.012 * Math.sin(1.7 * phase), 0.0),
                    )
        }
        stepDynamicGraphWithExponentialDecay(1f / 60f, state, edges, hash, system, 0.9)
        val now = edges.values().map { it.i to it.j }.toHashSet()
        appeared += (now - present).size
        vanished += (present - now).size
        present = now
    }
    return Flicker(
        appeared,
        vanished,
        present.size,
        dynamicGraphFLines(state.points, edges.values(), maxWeight = 3.0, colormap = "magma"),
    )
}

// rExit == rEnter switches hysteresis off.
val on = flicker(rExit = 0.075)
val off = flicker(rExit = 0.055)
println("hysteresis on:  ${on.appeared} edges created, ${on.vanished} lost, ${on.standing} standing after 150 frames")
println(
    "hysteresis off: ${off.appeared} edges created, ${off.vanished} lost, ${off.standing} standing after 150 frames",
)

showPlaneGrid(
    "rExit 0.075: ${on.appeared} in, ${on.vanished} out" to on.lines,
    "rExit = rEnter: ${off.appeared} in, ${off.vanished} out" to off.lines,
    columns = 2,
    cellWidth = 460,
    cellHeight = 460,
    window = dynamicGraphPlaneWindow(window),
)

:::fold the same thing with two points: walk them apart, past rEnter but inside rExit
// Two points walked apart from 0.05 to 0.13: past rEnter (0.10), inside rExit (0.16).
fun walk(rExit: Double): Pair<Boolean, Boolean> {
    val state = DynamicPointState(mutableListOf(Vec3(0f, 0f, 0f), Vec3(0.05f, 0f, 0f)))
    val edges = DynamicEdgeList(2)
    val hash = Vec3SpatialHash(0.2)
    val system = Vec3PersistentProximityHysteresisSystem(
        rEnter = 0.10,
        rExit = rExit,
        ttl = 0.2f,
        reinforce = 4.0,
        maxWeight = 8.0,
    )
    repeat(30) { stepDynamicGraphWithExponentialDecay(1f / 60f, state, edges, hash, system, 0.2) }
    val formedWhileClose = edges.get(0, 1) != null
    state.points[1] = Vec3(0.13f, 0f, 0f)
    repeat(60) { stepDynamicGraphWithExponentialDecay(1f / 60f, state, edges, hash, system, 0.2) }
    return formedWhileClose to (edges.get(0, 1) != null)
}

for (rExit in [0.16, 0.10]) {
    val (formed, survives) = walk(rExit)
    println("rExit $rExit: formed at d=0.05 = $formed, survives d=0.13 = $survives")
}
:::endfold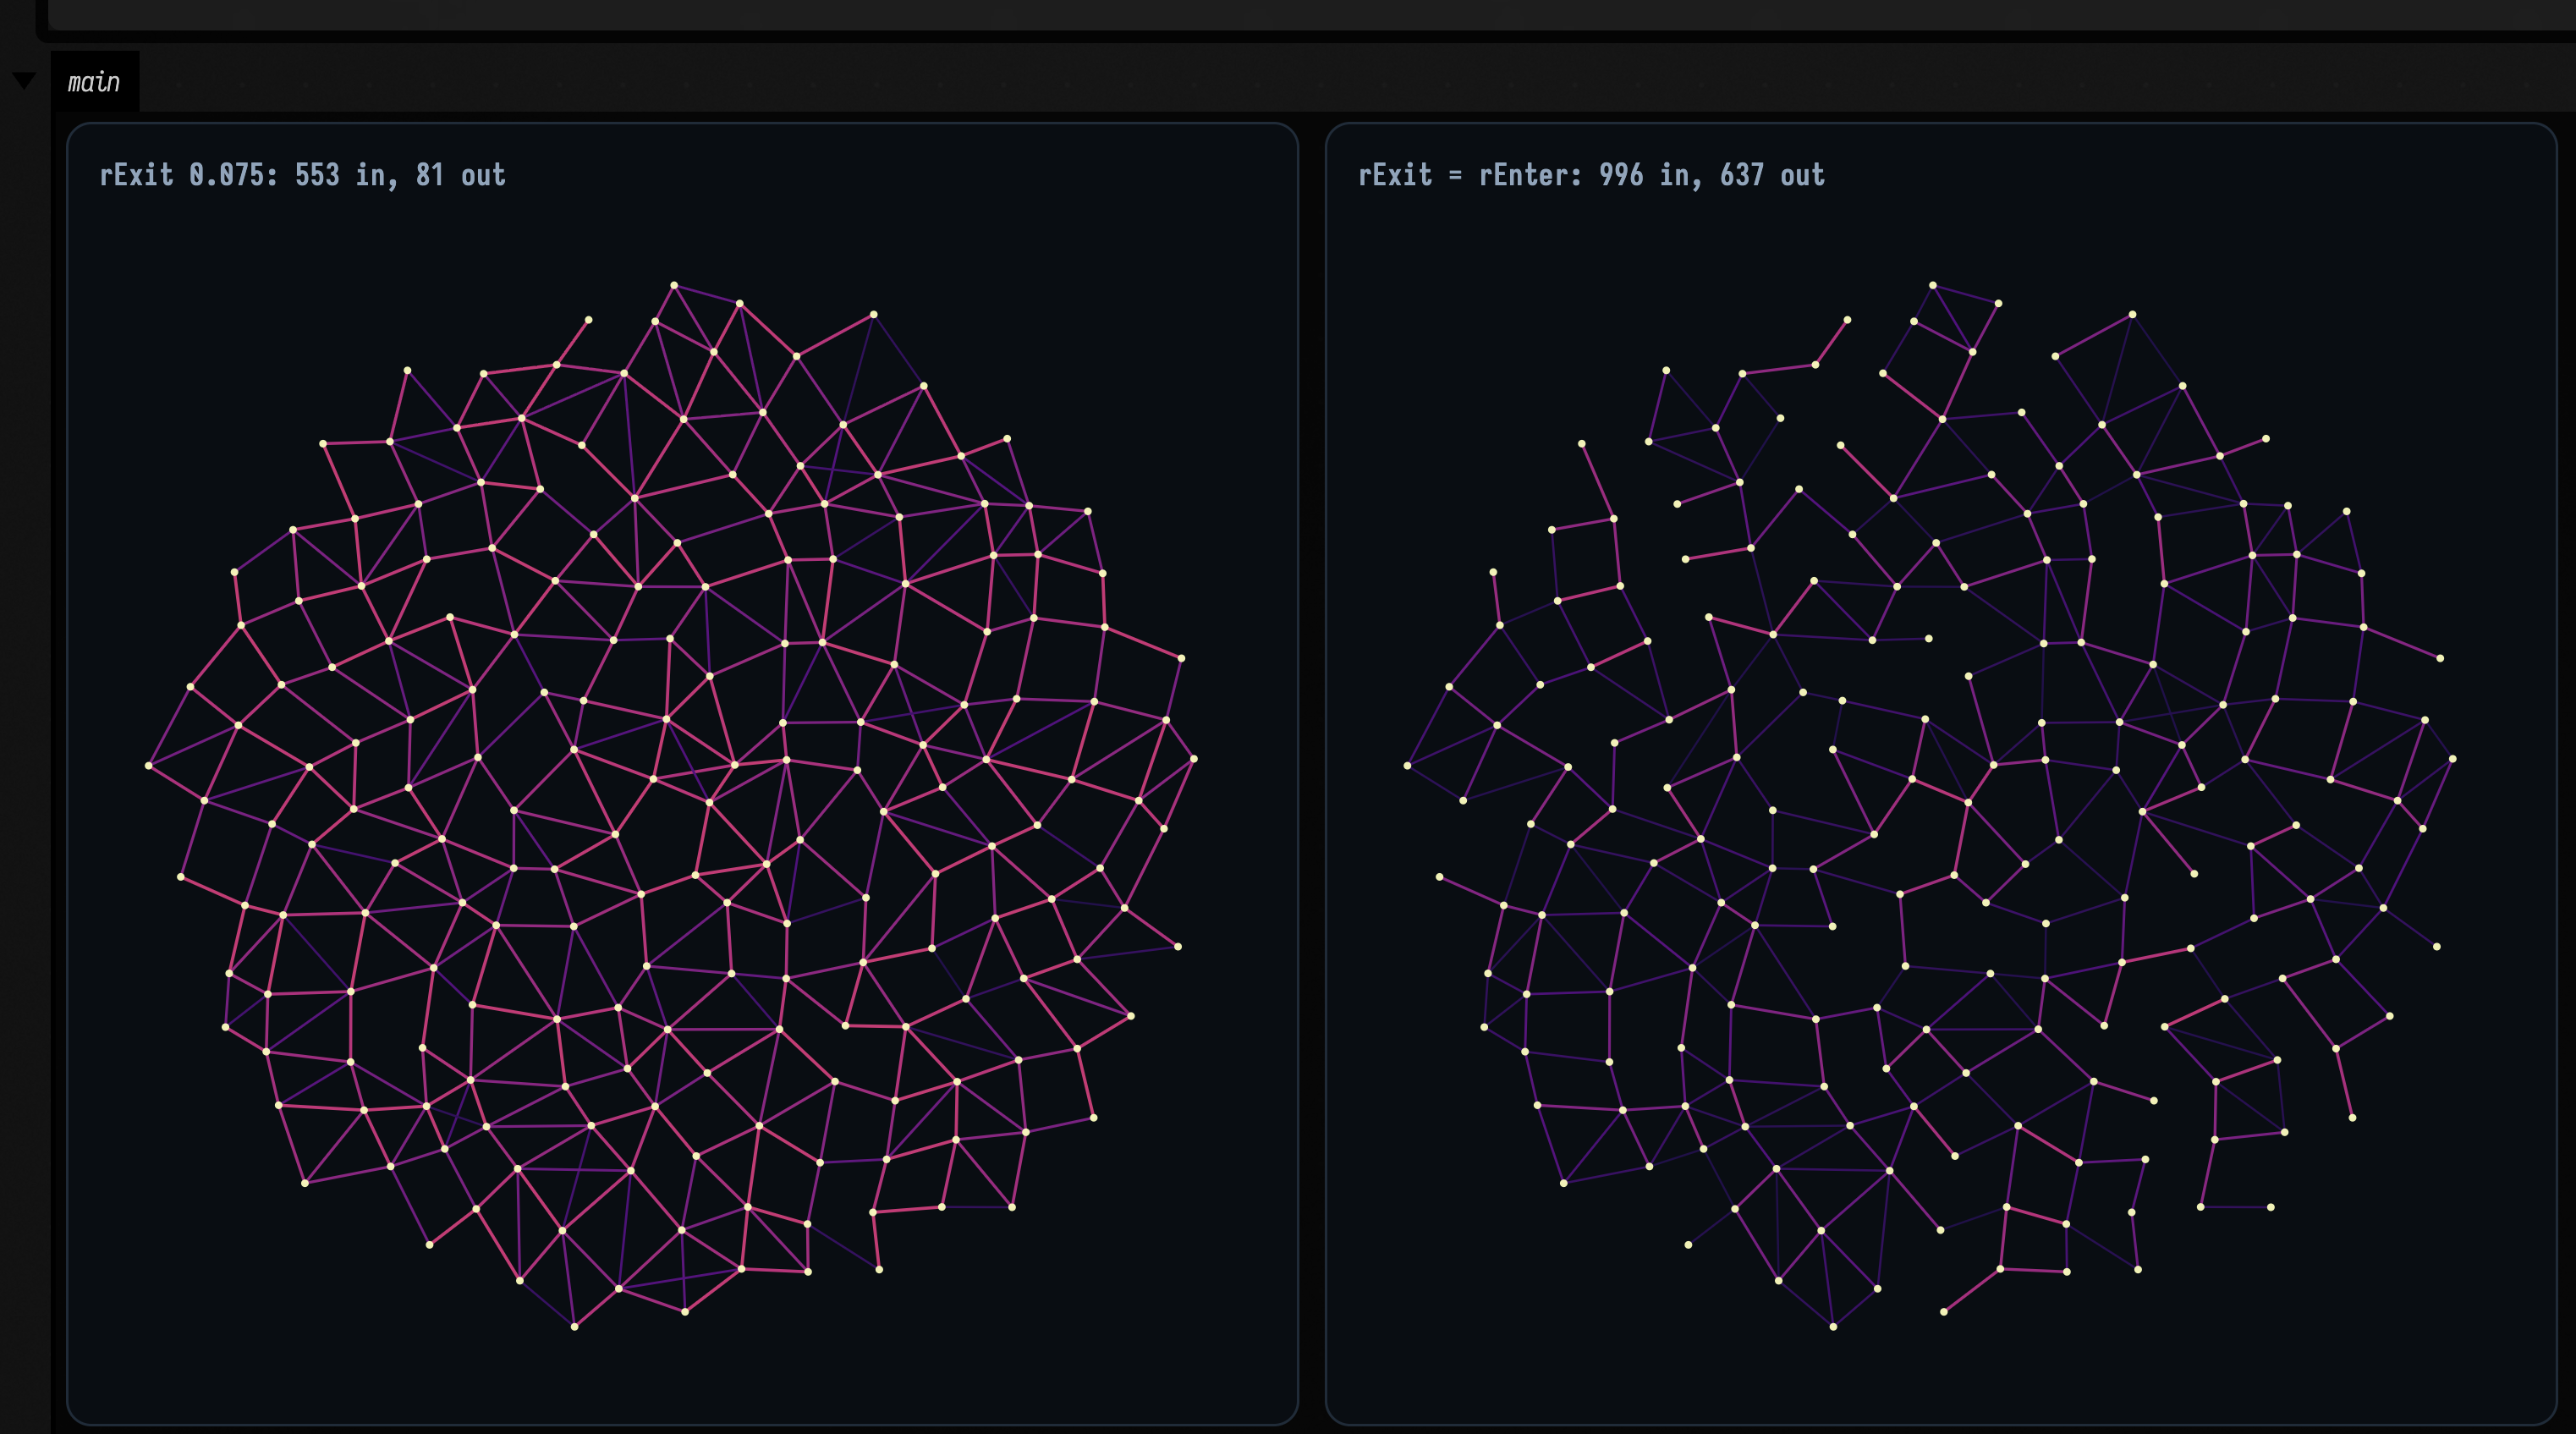
With hysteresis, the two points keep their edge as they walk apart; without it, the edge forms and
then dies. On the wobbling cloud, the run without hysteresis keeps losing edges and making new ones,
and ends with fewer. Those edges never last long enough to build up weight, so the graph never
remembers anything. If a dynamic graph looks sparse and restless, widen the gap between rEnter and
rExit first.
A graph that changes while the points stand still
Vec3BreathingAnisotropicKnnSystem changes its distance measure over time: it stretches distances
along an axis that rotates, by an amount that grows and shrinks. "The five nearest points" then has
a different answer from moment to moment, even when no point moves. The example runs it over a
cloud that stays still, beside the same system with its clock held at zero.
:::static
/*
The cloud does not move in this clip. Every edge that appears or disappears comes from the
anisotropic metric breathing: an axis that rotates with the clock and a stretch along it between
0.25 and 2.0. The right-hand panel runs the same k, cloud and code with the clock held at zero, so
its graph stays still.
*/
val n = 260
val cloud =
    List(n) { i ->
        val a = i * 2.39996322972865332
        val r = 0.5 * Math.sqrt((i + 0.5) / n)
        Vec3((r * Math.cos(a)).toFloat(), (r * Math.sin(a)).toFloat(), 0f)
    }
val window = dynamicGraphWindow(cloud, padFraction = 0.06)
val ceiling = 1.2

class Breath(
    val warped: DynamicPointState,
    val plain: DynamicPointState,
    val warpedEdges: DynamicEdgeList,
    val plainEdges: DynamicEdgeList,
    val hash: Vec3SpatialHash,
)

val warpedSystem = Vec3BreathingAnisotropicKnnSystem(
    k = 5,
    ttl = 0.25f,
    reinforce = 6.0,
    maxWeight = ceiling,
    mutualOnly = true,
    queryRadius = 0.13,
)
val plainSystem = Vec3BreathingAnisotropicKnnSystem(
    k = 5,
    ttl = 0.25f,
    reinforce = 6.0,
    maxWeight = ceiling,
    mutualOnly = true,
    queryRadius = 0.13,
)

val seed = Breath(
    DynamicPointState(cloud.map { Vec3(it) }.toMutableList()),
    DynamicPointState(cloud.map { Vec3(it) }.toMutableList()),
    DynamicEdgeList(n),
    DynamicEdgeList(n),
    Vec3SpatialHash(0.065),
)

animateEvolution(
    seed,
    totalSteps = 420,
    seconds = 8.0,
    columns = 2,
    cellSide = 460,
    framesTarget = 160,
    step = { s ->
        stepDynamicGraphWithExponentialDecay(1f / 60f, s.warped, s.warpedEdges, s.hash, warpedSystem, 2.5)
        // The system advances state.time itself, so pinning it either side of the call is what
        // "the same code with the time-dependence removed" means.
        s.plain.time = 0f
        stepDynamicGraphWithExponentialDecay(1f / 60f, s.plain, s.plainEdges, s.hash, plainSystem, 2.5)
        s.plain.time = 0f
        s
    },
    panels = { s, step ->
        [
            "breathing, t=%.2fs, %d edges".format(s.warped.time, s.warpedEdges.values().size) to
                dynamicGraphPanel(s.warped.points, s.warpedEdges.values(), window, 460, 460, ceiling, "magma"),
            "frozen, step %d, %d edges".format(step, s.plainEdges.values().size) to
                dynamicGraphPanel(s.plain.points, s.plainEdges.values(), window, 460, 460, ceiling, "magma"),
        ]
    },
)
The edge count under each panel tells them apart: the frozen panel's never changes, and the breathing panel's rises and falls as its patches swing round with the stretch axis. When the stretch is strong, "near" means near along the current axis, so long thin chains form in that direction and links across it are dropped. As the stretch relaxes, the graph evens out again.
Both panels use a short ttl and fast decay, so the graph remembers only about a quarter of a
second. With a long ttl the edges from every past stretch pile up into a mesh that stops changing.
Why the clips are rasters and the stills are not
animateEvolution's panels lambda is typed List<Pair<String, Img>>, and the docs runner
records a box's PNG output channel, so an animated figure is a raster by construction. That is
what dynamicGraphPanel is for; the stills
go through dynamicGraphFLines into showPlaneGrid and stay vector. rasterizeFLines from the
ALife family is not a substitute, because it plots a constant intensity: every edge would come out
the same brightness and the weight would be gone from the picture.
Growing the points as well as the graph
The DynamicPointProcesses move the points. You chain them in a DynamicProcessPipeline, and
between them they push points along the graph, add new ones at growing tips, merge points that
collide, spread a resource along the edges and move points up its gradient, and remove what has come
loose. The edges then decide where the points go, and the points decide which edges are proposed.
Tip growth has no limit of its own, and once it starts the population grows quickly, so set a cap
with maxPointCount. The example starts from a ring of points, caps it at 900, and runs the full
pipeline beside the same pipeline without DirectedTipGrowthProcess. Most of the growth happens
early, so the clip uses a geometric step schedule (ramp) to slow the start down and speed up the
end.
:::static
/*
The full pipeline: diffuse a resource along the edges and climb its gradient, relax the springs,
grow tips where the incident edges pull coherently, merge what has collided, smooth, jitter.
The right-hand panel is the same pipeline with ONE stage removed -- tip growth -- so the
difference between the panels is that stage and nothing else.
*/
val seedRing =
    List(64) { i ->
        val a = 2.0 * Math.PI * i / 64
        Vec3((0.42 * Math.cos(a)).toFloat(), (0.42 * Math.sin(a)).toFloat(), 0f)
    }
// A window sized for where the structure ends up, not for the seed. Fitting to the seed would put
// the whole clip against the frame edge; re-fitting per frame would make the growth invisible.
val window = doubleArrayOf(-0.95, -0.95, 0.95, 0.95)
val ceiling = 3.0

class Morph(
    val state: DynamicPointState,
    val kinetics: DynamicPointKinetics,
    val edges: DynamicEdgeList,
    val hash: Vec3SpatialHash,
    val pipeline: DynamicProcessPipeline,
    val system: DynamicGraphSystem,
)

fun morph(grow: Boolean): Morph {
    val state = DynamicPointState(seedRing.map { Vec3(it) }.toMutableList())
    val kinetics = DynamicPointKinetics(mutableListOf(), mutableListOf(), mutableListOf())
    kinetics.ensureSize(state.pointCount)
    // Seed the resource on a quarter of the ring, so chemotaxis has a gradient to climb.
    for (i in 0 until 16) kinetics.resource[i] = 6.0
    val stages = mutableListOf<DynamicPointProcess>(
        SignalDiffusionAndChemotaxisProcess(diffusionRate = 0.5, chemoGain = 0.35, maxSpeed = 0.30),
        // rest = restLengthTimesWeight / weight: a rest length of 0.05 at a typical weight of 1.5
        // is 0.075.
        SpringMotionProcess(springK = 1.2, damping = 3.0, restLengthTimesWeight = 0.075, maxSpeed = 0.30),
    )
    if (grow)
        stages +=
            DirectedTipGrowthProcess(
                coherenceThreshold = 1.6,
                spawnDistance = 0.035,
                localDensityRadius = 0.05,
                localDensityMax = 6,
                childEdgeWeight = 1.5,
                childEdgeTtl = 1.5f,
                maxWeight = ceiling,
                maxPointCount = 900,
            )
    stages += MergeClosePointsProcess(mergeDistance = 0.012, minCombinedWeight = 2.0)
    stages += RelaxToMidpointProcess(gain = 1.5)
    stages += JitterProcess(amplitude = 0.04)
    return Morph(
        state,
        kinetics,
        DynamicEdgeList(state.pointCount),
        Vec3SpatialHash(0.05),
        DynamicProcessPipeline(stages),
        Vec3PersistentProximityHysteresisSystem(
            rEnter = 0.05,
            rExit = 0.07,
            ttl = 0.8f,
            reinforce = 3.0,
            maxWeight = ceiling,
        ),
    )
}

animateEvolution(
    morph(grow = true) to morph(grow = false),
    totalSteps = 560,
    seconds = 10.0,
    columns = 2,
    cellSide = 490,
    framesTarget = 200,
    // Geometric: the 900-point cap is reached around step 79, so a linear schedule would spend
    // seven eighths of the clip on the aftermath. ramp = 25 puts the clip's mid-point at step 93.
    ramp = 25.0,
    step = { (grown, flat) ->
        for (m in [grown, flat]) {
            stepDynamicGraphWithExponentialDecay(1f / 60f, m.state, m.edges, m.hash, m.system, 0.6)
            m.pipeline.step(1f / 60f, m.state, m.kinetics, m.edges, m.hash)
        }
        grown to flat
    },
    panels = { (grown, flat), step ->
        [
            "grow ON  s%d  %dpts %de".format(step, grown.state.pointCount, grown.edges.values().size) to
                dynamicGraphPanel(grown.state.points, grown.edges.values(), window, 490, 490, ceiling, "magma"),
            "grow OFF  s%d  %dpts %de".format(step, flat.state.pointCount, flat.edges.values().size) to
                dynamicGraphPanel(flat.state.points, flat.edges.values(), window, 490, 490, ceiling, "magma"),
        ]
    },
)
With tip growth, the ring grows into branching filaments. The edge count jumps as the new points
crowd into the ring's footprint, then falls as the springs push them apart, leaving the branching
skeleton. Without tip growth the ring stays a ring, and loses a few points as the springs pull
neighbours together and MergeClosePointsProcess merges them.
Snapshots and the minWeight cut
toPointGraph and dynamicGraphSnapshot turn the live edges into the PointGraph used on the
neighbours and graphs page, keeping only edges whose weight is at
least minWeight. Edges between points that have stayed together have built up weight; edges made in
passing have not, so the cut keeps the first and drops the second.
The example below has a still background of points and three rigid clusters that move across it in
straight lines. Points inside a cluster stay neighbours for the whole run; a cluster point and a
background point are neighbours only briefly. A high enough minWeight should separate the three
clusters from the background.
:::static
// A static background mesh with three rigid clusters crossing it. The minWeight cut has to separate
// "adjacent for four seconds" from "adjacent in passing" using nothing but accumulated weight.
fun disc(n: Int, r: Double) =
    List(n) { i ->
        val a = i * 2.39996322972865332
        val rad = r * Math.sqrt((i + 0.5) / n)
        Vec3((rad * Math.cos(a)).toFloat(), (rad * Math.sin(a)).toFloat(), 0f)
    }

val nBg = 240
val perCluster = 22
val n = nBg + 3 * perCluster
val background = disc(nBg, 0.50)
val blobs = List(3) { disc(perCluster, 0.070) }
val starts = [Vec3(-0.44f, -0.20f, 0f), Vec3(-0.30f, 0.40f, 0f), Vec3(0.34f, -0.44f, 0f)]
val velocities = [Vec3(0.20f, 0.07f, 0f), Vec3(0.16f, -0.19f, 0f), Vec3(-0.12f, 0.20f, 0f)]
// group: -1 background, else which cluster. Only used to check the answer, not to build the graph.
val group = IntArray(n) { if (it < nBg) -1 else (it - nBg) / perCluster }

val points = MutableList(n) { Vec3(0f, 0f, 0f) }
for (i in 0 until nBg) points[i] = Vec3(background[i])
val state = DynamicPointState(points)
val edges = DynamicEdgeList(n)
val hash = Vec3SpatialHash(0.055)
val ceiling = 3.0
val system = Vec3PersistentProximityHysteresisSystem(
    rEnter = 0.062,
    rExit = 0.075,
    ttl = 0.4f,
    reinforce = 2.5,
    maxWeight = ceiling,
)

repeat(240) { f ->
    val t = f / 60.0
    for (c in 0 until 3) {
        val centre = Vec3(starts[c]).add(Vec3(velocities[c]).mul(t.toFloat()))
        for (k in 0 until perCluster) {
            state.points[nBg + c * perCluster + k] = Vec3(blobs[c][k]).add(centre)
        }
    }
    stepDynamicGraphWithExponentialDecay(1f / 60f, state, edges, hash, system, 0.30)
}
println(dynamicGraphSummary(state, edges))

// Connected components of the snapshot, by union-find over the PointGraph the static library sees.
fun componentSizes(graph: PointGraph): List<Int> {
    val parent = IntArray(graph.pointCount) { it }
    fun find(a: Int): Int {
        var x = a
        while (parent[x] != x) {
            parent[x] = parent[parent[x]]
            x = parent[x]
        }
        return x
    }
    for (e in graph.edges) {
        val ra = find(e.i)
        val rb = find(e.j)
        if (ra != rb) parent[ra] = rb
    }
    val sizes = HashMap<Int, Int>()
    for (v in 0 until graph.pointCount) sizes.merge(find(v), 1) { a, b -> a + b }
    return sizes.values.sortedDescending()
}

// Pinned rather than fitted, because the clusters are somewhere else at t = 0 and at t = 4 s: a
// window derived from the final frame would frame a different picture from the one the run made.
val window = doubleArrayOf(-0.60, -0.60, 0.60, 0.60)
println("points outside that window: ${dynamicGraphOutsideWindow(state.points, window)}")

/*
A force-directed layout of one snapshot: a spring along every edge it kept, repulsion between every
pair of points, and a weak pull to the centre so separate components stay on the page. It starts
from where the points physically are and sees nothing but the snapshot's edges, so whatever comes
apart here came apart in the graph.
*/
fun relaxed(graph: PointGraph, start: List<Vec3>, iterations: Int = 300): List<Vec3> {
    val n = graph.pointCount
    val x = DoubleArray(n) { start[it].x.toDouble() }
    val y = DoubleArray(n) { start[it].y.toDouble() }
    val k = 0.04
    var step = 0.02
    repeat(iterations) {
        val fx = DoubleArray(n)
        val fy = DoubleArray(n)
        for (i in 0 until n) for (j in i + 1 until n) {
            val ex = x[i] - x[j]
            val ey = y[i] - y[j]
            val f = k * k / maxOf(ex * ex + ey * ey, 1e-6)
            fx[i] += ex * f
            fy[i] += ey * f
            fx[j] -= ex * f
            fy[j] -= ey * f
        }
        for (e in graph.edges) {
            val ex = x[e.i] - x[e.j]
            val ey = y[e.i] - y[e.j]
            val f = Math.sqrt(ex * ex + ey * ey) / k
            fx[e.i] -= ex * f
            fy[e.i] -= ey * f
            fx[e.j] += ex * f
            fy[e.j] += ey * f
        }
        for (i in 0 until n) {
            fx[i] -= 0.6 * x[i]
            fy[i] -= 0.6 * y[i]
            val len = Math.sqrt(fx[i] * fx[i] + fy[i] * fy[i])
            if (len > 0) {
                val s = minOf(len, step) / len
                x[i] += fx[i] * s
                y[i] += fy[i] * s
            }
        }
        step *= 0.99
    }
    // Fit to the same window the physical panels use.
    val cx = (x.max() + x.min()) / 2
    val cy = (y.max() + y.min()) / 2
    val half = maxOf(x.max() - x.min(), y.max() - y.min()) / 2
    val s = 0.55 / half
    return List(n) { Vec3(((x[it] - cx) * s).toFloat(), ((y[it] - cy) * s).toFloat(), 0f) }
}

// Every threshold is measured; two of them are drawn, each as the run left it and relaxed.
val panels =
    [0.0, 0.5, 1.2, 2.0].flatMap { cut ->
        val graph = edges.toPointGraph(minWeight = cut)
        val groups = componentSizes(graph).filter { it > 1 }
        val cross = graph.edges.count { group[it.i] != group[it.j] }
        println(
            "minWeight %.1f -> %4d edges, %3d of them cross a group boundary, components > 1: %s"
                .format(
                    cut,
                    graph.edges.size,
                    cross,
                    groups,
                ),
        )
        if (cut != 0.0 && cut != 1.2) return@flatMap emptyList()
        val kept = edges.values().filter { it.weight > cut }
        [
            "w>%.1f  as it ran".format(cut) to
                dynamicGraphFLines(state.points, kept, maxWeight = ceiling, colormap = "magma"),
            "w>%.1f  relaxed, %d groups".format(cut, groups.size) to
                dynamicGraphFLines(relaxed(graph, state.points), kept, maxWeight = ceiling, colormap = "magma"),
        ]
    }
showPlaneGrid(
    *panels.toTypedArray(),
    columns = 2,
    cellWidth = 430,
    cellHeight = 430,
    window = dynamicGraphPlaneWindow(window),
)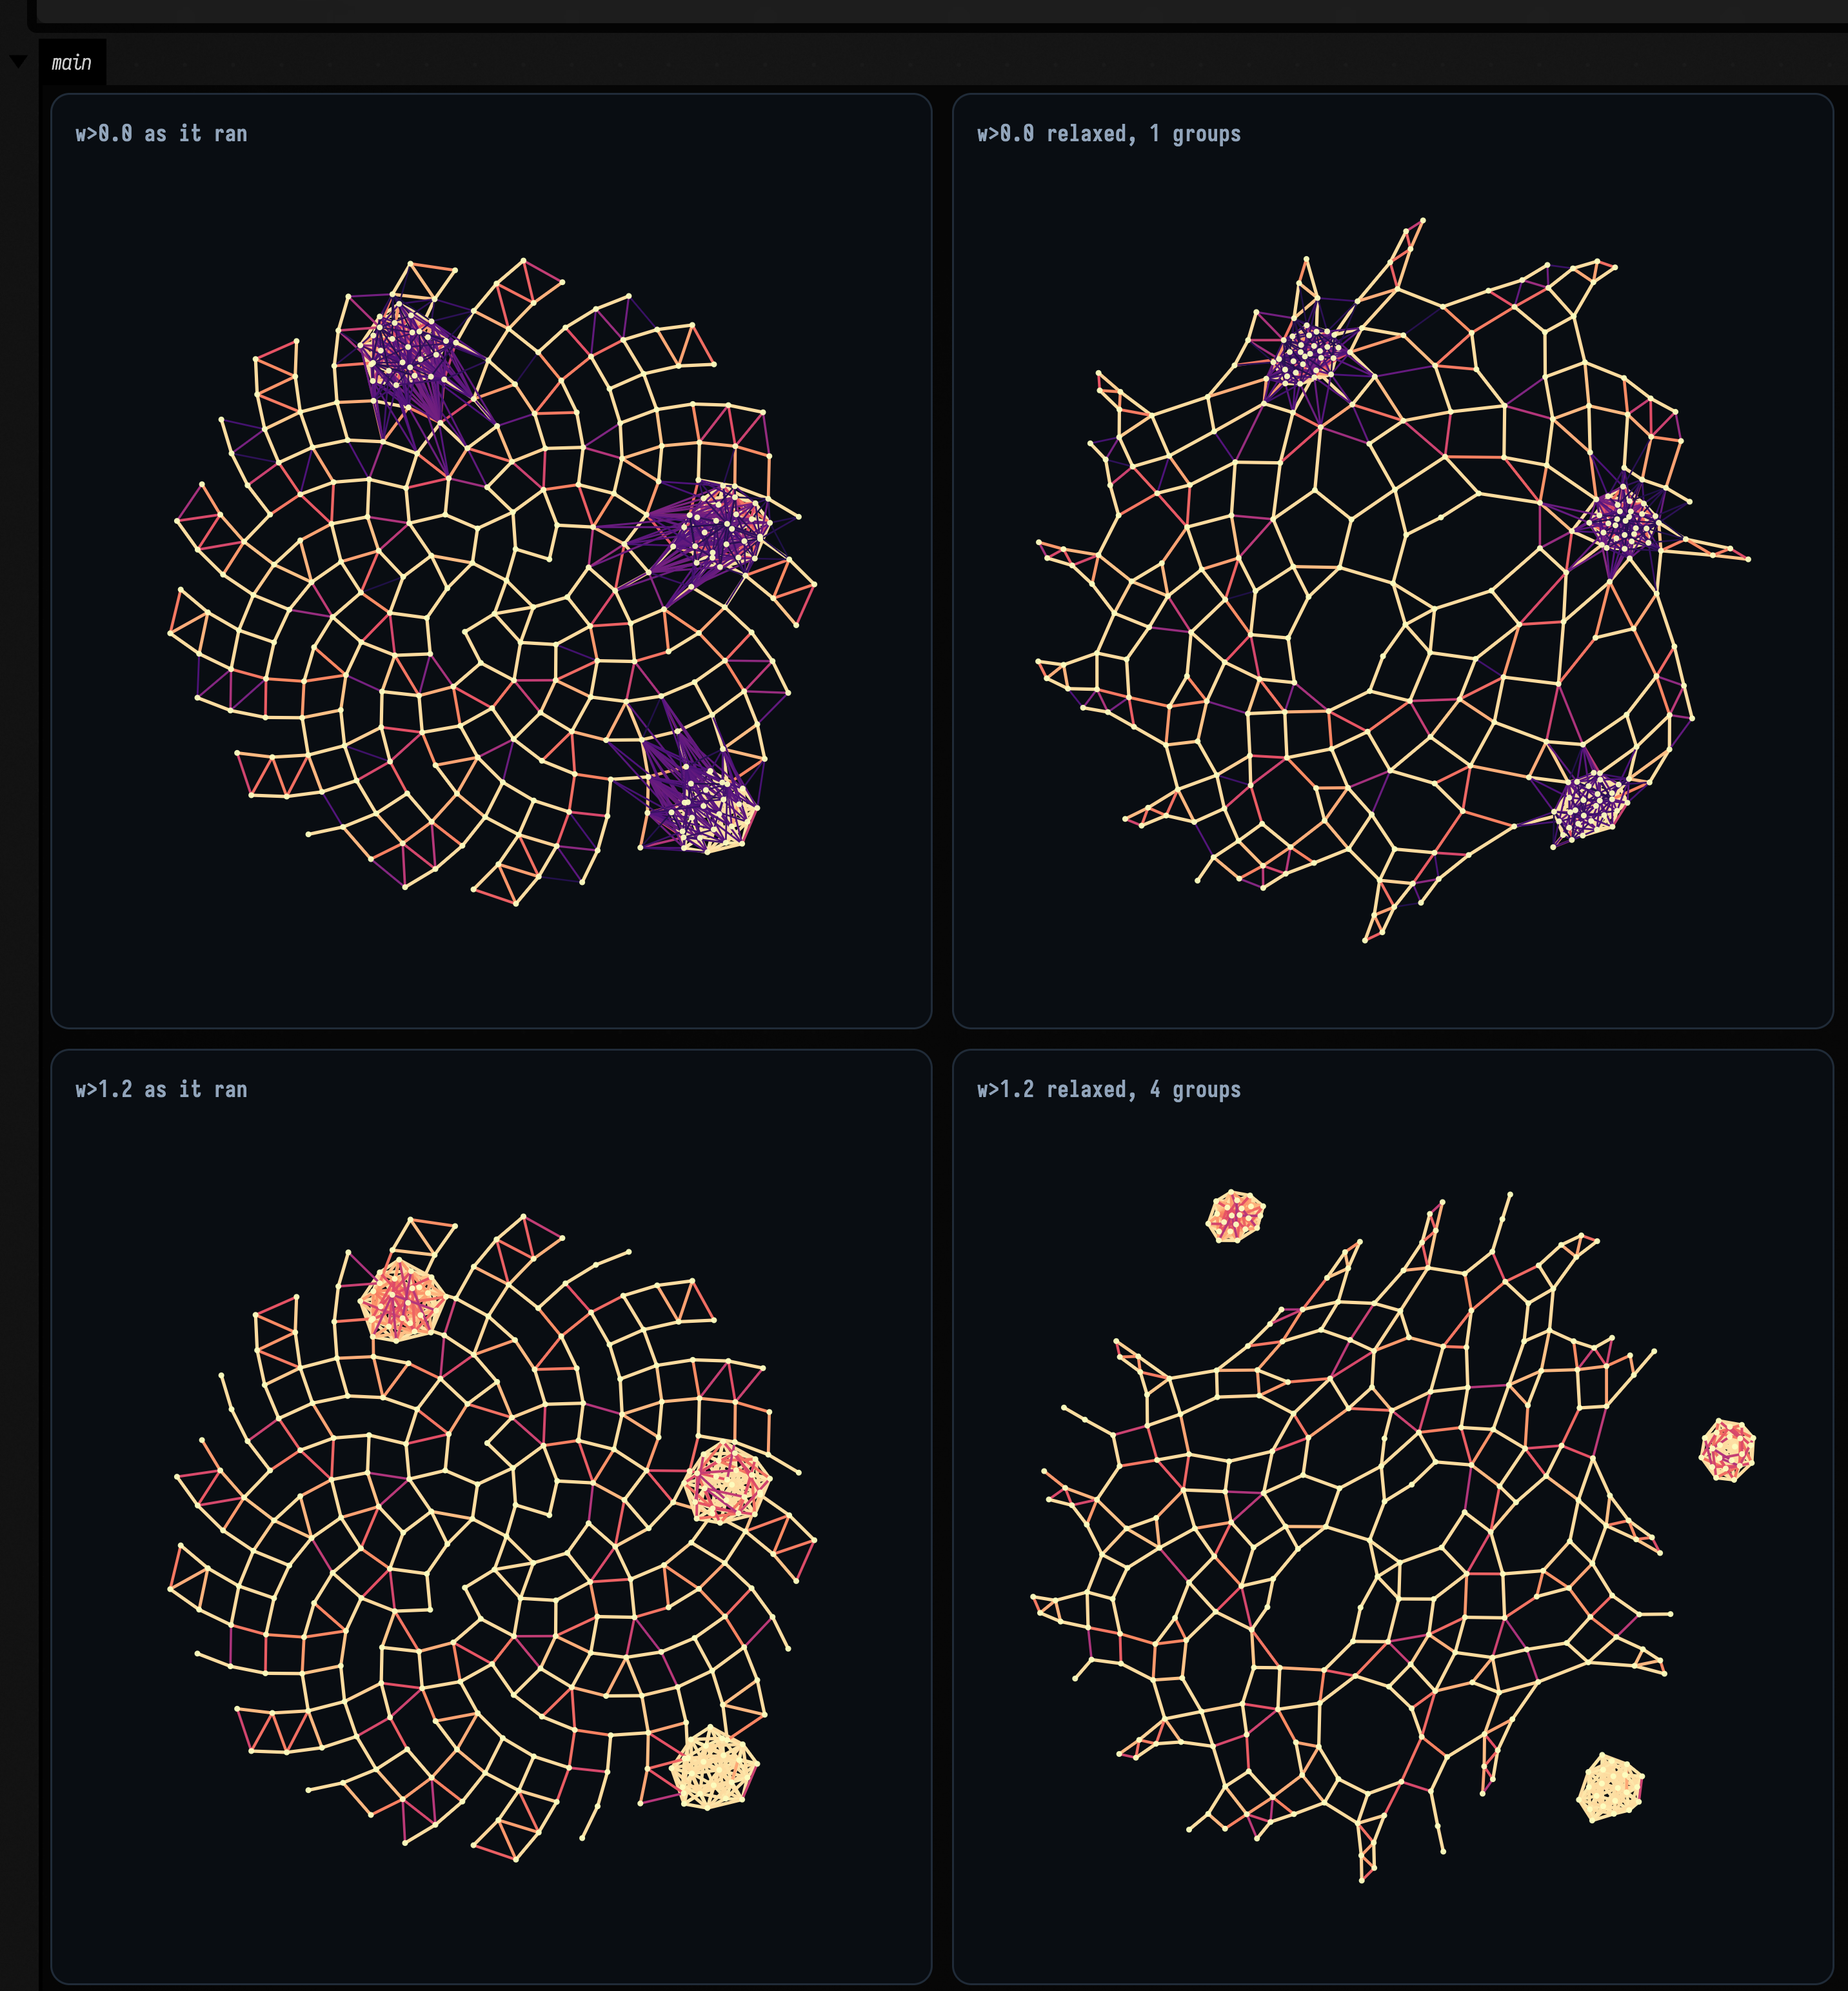
With no cut, the dim purple edges made in passing tie the clusters into the background. At
minWeight = 1.2 those edges are gone, and the snapshot falls apart into the background and the
three clusters, each complete. The graph is built only from positions over time; the code's group
array is used only to check the result.
The left-hand panels draw each snapshot where the run left its points, so the clusters sit on top of the background. The right-hand panels lay the same snapshot out again with springs along the kept edges, so you can see what is connected to what. Below the threshold the clusters stay inside one net; above it they come away as three separate knots.
A nearest-neighbour graph of the last frame cannot tell a point that has been beside you for the whole run from one that arrived a frame ago. A weighted, decaying graph can.
See also
- Neighbours and graphs on a point cloud:
PointGraph, traversal, path covers and drawing graphs asFLines. Snapshots from this page turn into these graphs. - Spatial artificial life: local rules making larger structure on grids, fields and populations of agents.
- Voronoi, contours & clusters — when what you want from a moving cloud is a partition rather than a graph.
- Meshes & 3D geometry — where a triangulated dynamic graph wants to end up.
The public declarations used on this page are listed, with their KDoc, in the codebase reference:
dynamic_graph_systems.kt and
dynamic_graph_field.kt. Start from
what's already in the box.