Sorting networks to FLine examples
A sorting network is a fixed list of compare-and-swap steps between wires: the plan is decided ahead of time, and only the data changes. Because the plan is fixed, it can be drawn. This page draws two networks, plots how quickly each one removes disorder from random inputs, and then uses SortingNetwork.anneal(...) to search for smaller networks. All four examples are boxes in the sorting_networks starting point.
Topology: bubble against odd-even merge
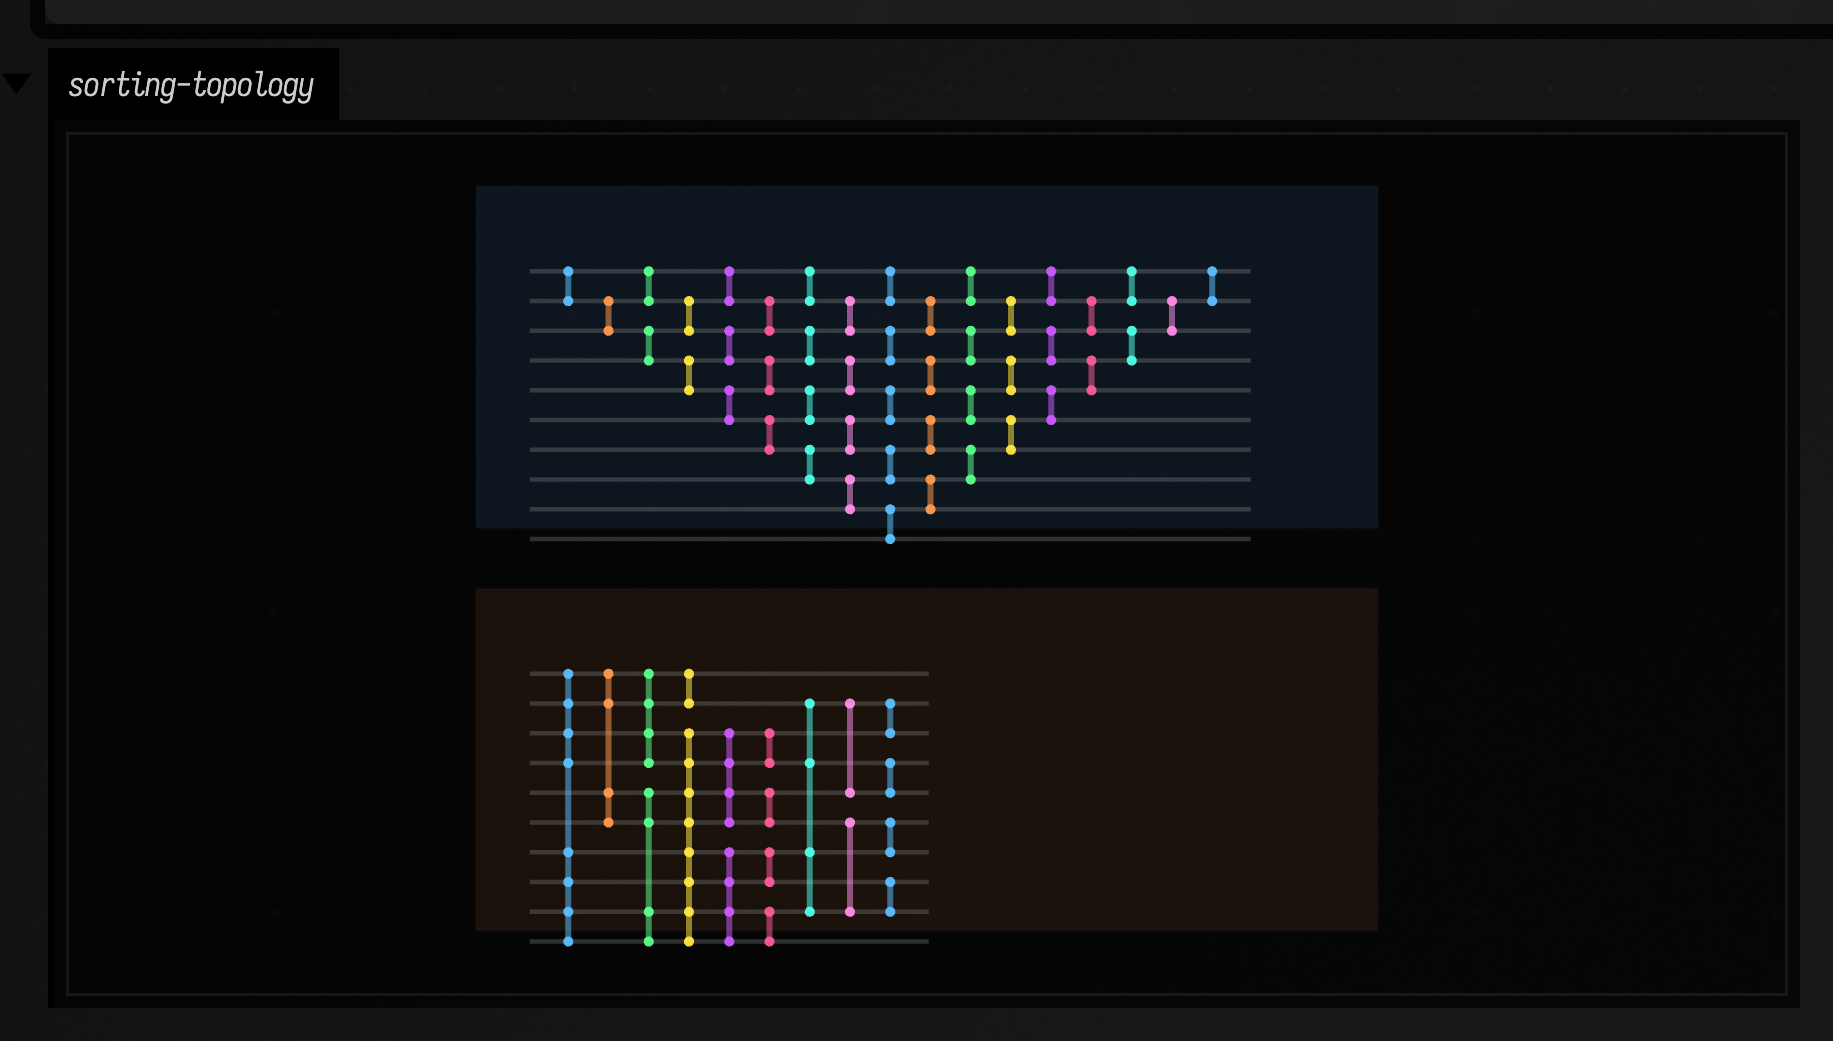
This example builds a bubble network and Batcher's odd-even merge network on ten wires and draws them one above the other at the same column spacing, so their widths can be compared directly. Bubble uses n * (n - 1) / 2 comparators; each comparator is placed in the earliest column it can go. Odd-even merge uses O(n log²n) comparators in O(log²n) columns.
:::static
val bubble = SortingNetwork.bubble(10)
val merge = SortingNetwork.oddEvenMerge(10)

:::fold two tinted panels to hold the diagrams
fun shift(lines: List<FLine>, dx: Double, dy: Double) = lines.map { it + vec(dx, dy, 0) }

fun panel(x: Double, y: Double, w: Double, h: Double, color: Vec4) = fline {
    rect(x, y, w, h)
    filled = true
    stroked = true
    thickness = 1.2
    this.color = color
}

val frames = [
    panel(30.0, 40.0, 1030.0, 390.0, vec(0.08, 0.14, 0.20, 0.55)),
    panel(30.0, 500.0, 1030.0, 390.0, vec(0.18, 0.11, 0.07, 0.52)),
]

:::endfold

lines(
    frames +
        shift(bubble.toFLines(wireSpacing = 34.0, layerSpacing = 46.0, margin = 42.0), 70.0, 95.0) +
        shift(merge.toFLines(wireSpacing = 34.0, layerSpacing = 46.0, margin = 42.0), 70.0, 555.0),
    channel = "sorting-topology",
    w = 1120.0,
    h = 940.0,
    fitToSize = true,
)
The top panel is almost twice as wide as the bottom one, so the difference in cost shows before any input has gone through either network.
Disorder collapse across layers
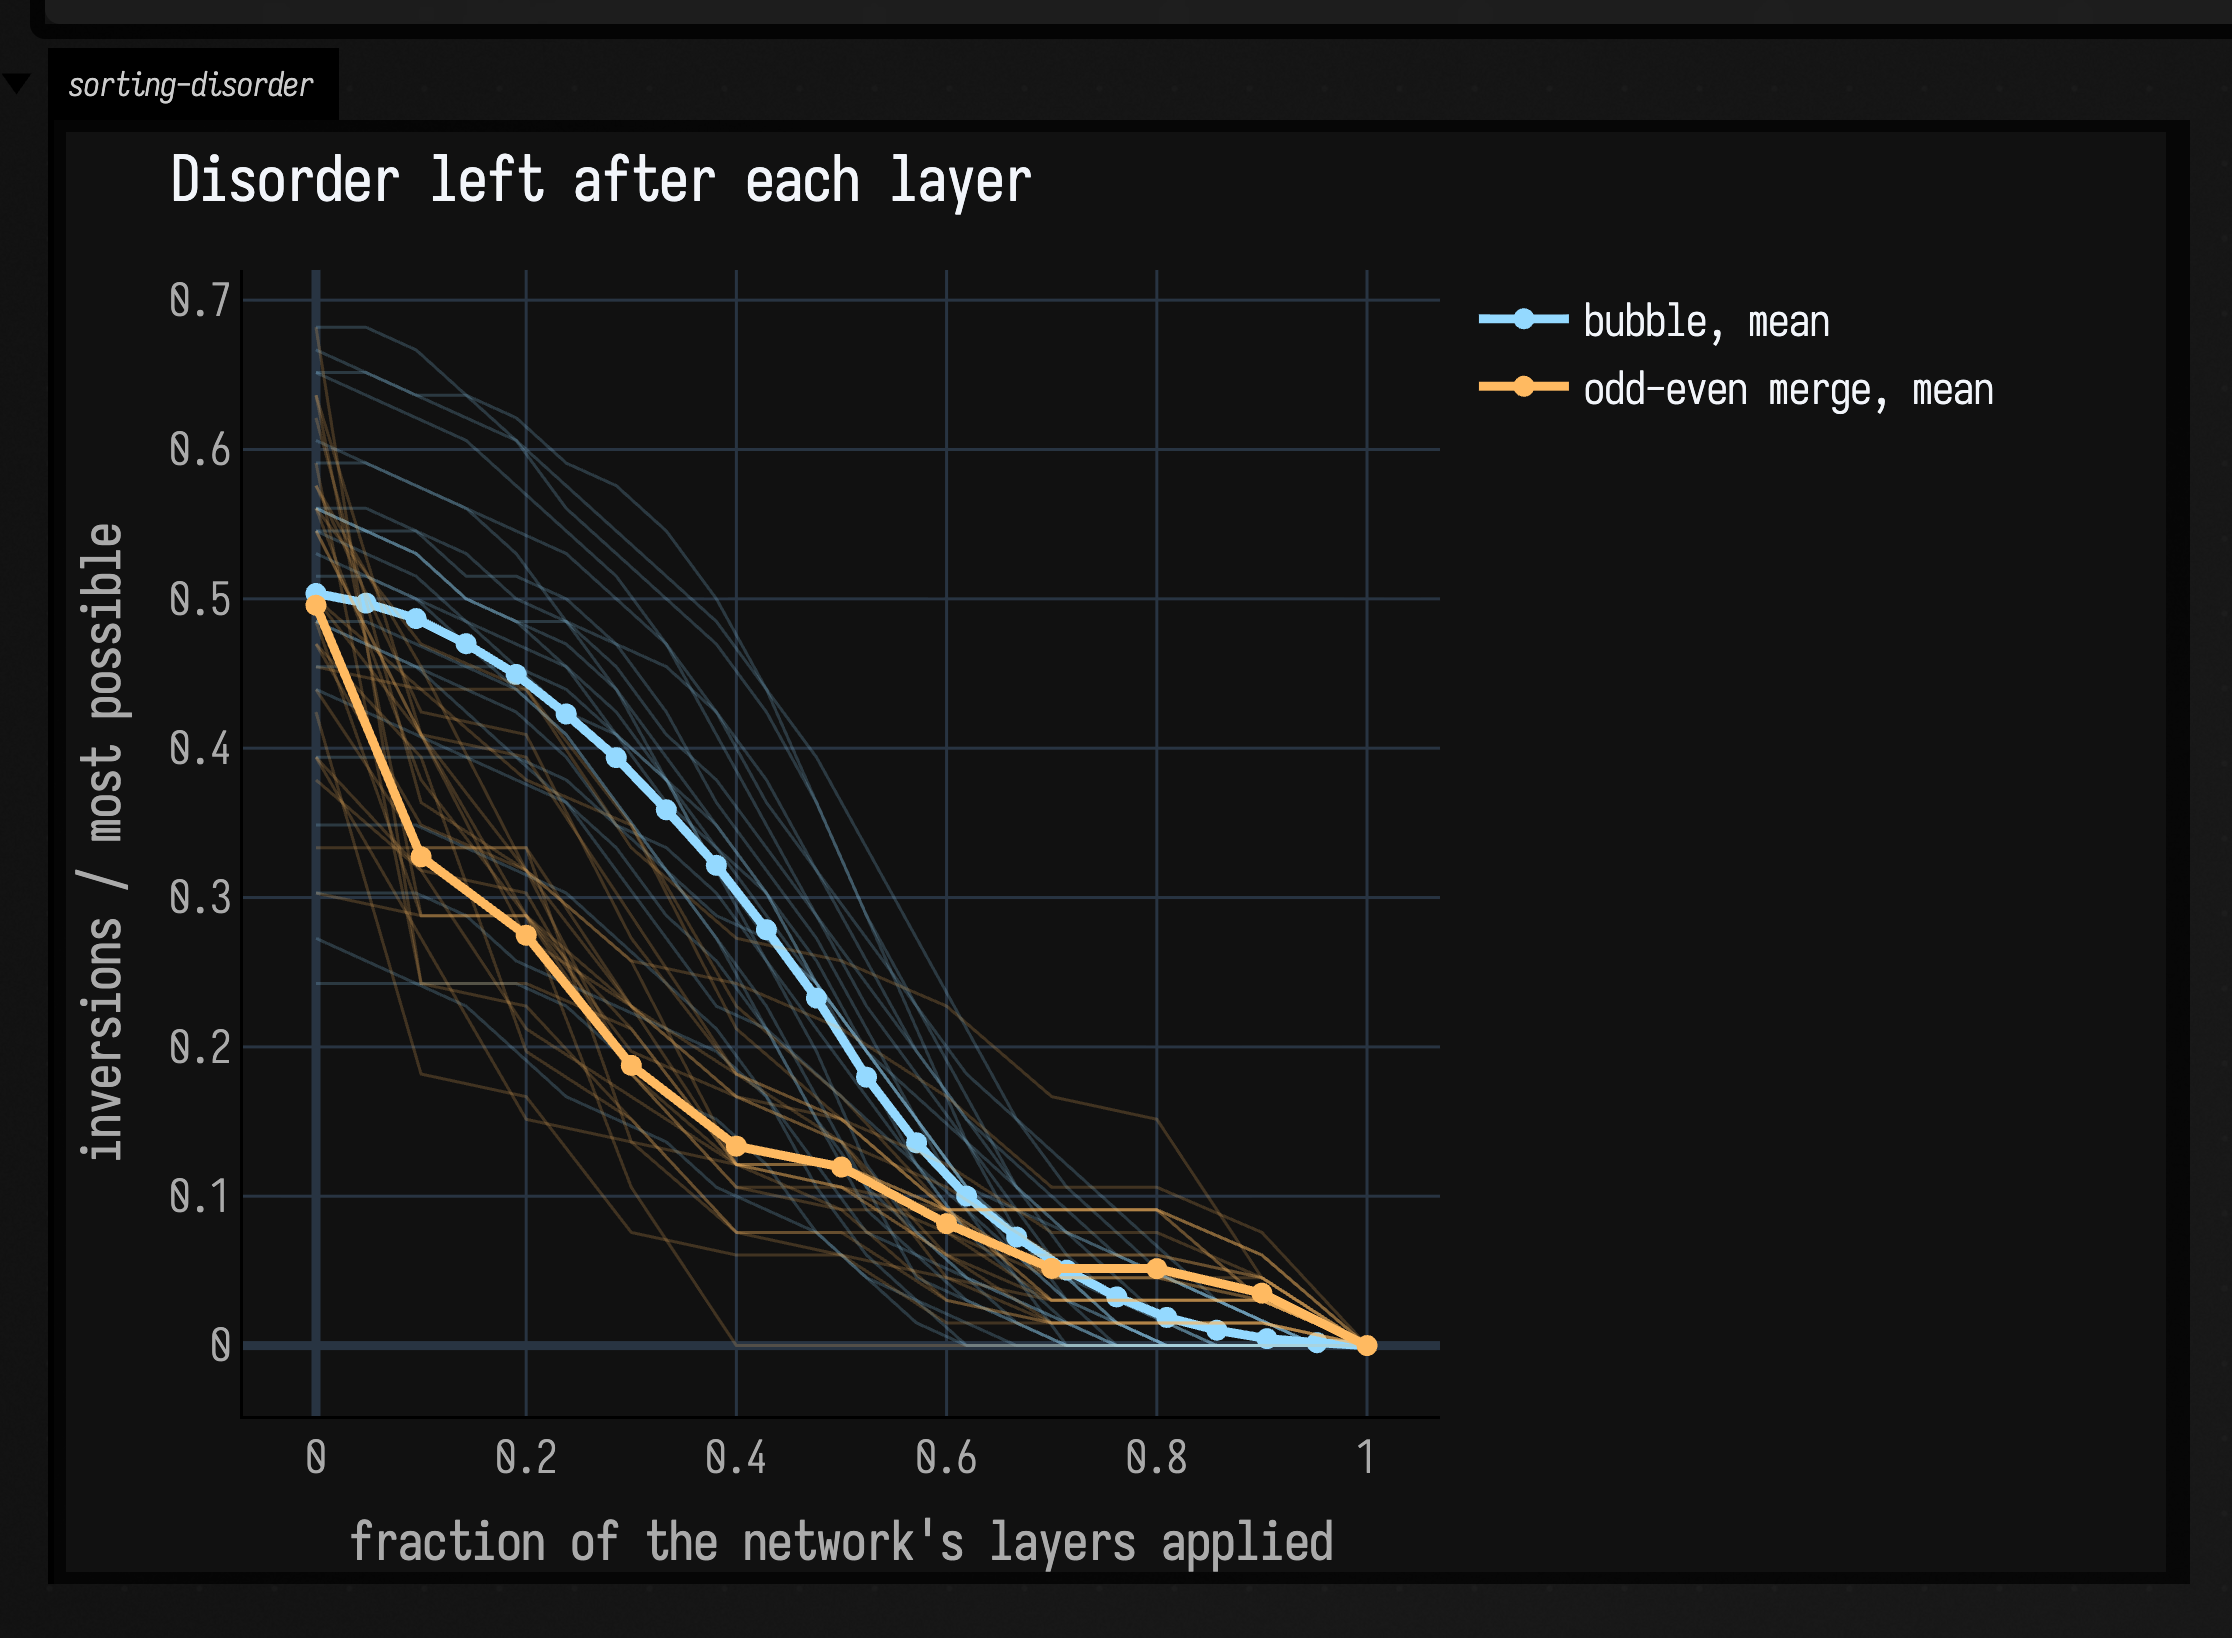
A diagram doesn't show how quickly a network removes disorder. layerTrace(...) returns the wire values after every column of comparators, so you can follow a random permutation as it is sorted. This example traces random twelve-wire inputs through both networks and plots each trace's inversion count (the number of out-of-order pairs), divided by the inversion count of a fully reversed input so that every curve starts at or below 1.
:::static
import space.kscience.plotly.*
import space.kscience.plotly.models.ScatterMode

val n = 12
val meanSamples = 180
val traceCount = 24
val bubble = SortingNetwork.bubble(n)
val merge = SortingNetwork.oddEvenMerge(n)
val maxInv = n * (n - 1) / 2.0

:::fold random permutations and an O(n²) inversion count
fun randomPermutation(size: Int): IntArray {
    val xs = (0 until size).toMutableList()
    xs.shuffle()
    return xs.toIntArray()
}

fun inversions(values: IntArray): Int {
    var inv = 0
    for (i in values.indices) for (j in i + 1 until values.size) if (values[i] > values[j]) inv++
    return inv
}

:::endfold

fun profile(net: SortingNetwork): List<Double> {
    val sums = DoubleArray(net.depth() + 1)
    repeat(meanSamples) {
        net.layerTrace(randomPermutation(n)).forEachIndexed { index, snapshot ->
            sums[index] += inversions(snapshot) / maxInv
        }
    }
    return sums.map { it / meanSamples.toDouble() }
}

fun traceFamily(net: SortingNetwork, count: Int): List<List<Double>> = List(count) {
    net.layerTrace(randomPermutation(n)).map { inversions(it) / maxInv }
}

val bubbleTraces = traceFamily(bubble, traceCount)
val mergeTraces = traceFamily(merge, traceCount)
val bubbleProfile = profile(bubble)
val mergeProfile = profile(merge)

// Each network's layers are spread over 0..1, so the two curves compare shape, not depth.
fun progress(values: List<Double>) = values.indices.map { it / (values.size - 1).toDouble() }

// Faint lines for single inputs, a bold line with a marker per layer for the mean.
fun Plot.network(label: String, traces: List<List<Double>>, mean: List<Double>, hue: String) {
    for (trace in traces) scatter {
        x.set(progress(trace))
        y.set(trace)
        mode = ScatterMode.lines
        line {
            color(hue)
            width = 1.0
        }
        opacity = 0.2
        showlegend = false
    }
    scatter {
        name = "$label, mean"
        x.set(progress(mean))
        y.set(mean)
        mode = ScatterMode.`lines+markers`
        line {
            color(hue)
            width = 3.0
        }
        marker {
            size = 7
            color(hue)
        }
    }
}

display(
    "sorting-disorder",
    Plotly.plot {
            network("bubble", bubbleTraces, bubbleProfile, "#94d9ff")
            network("odd-even merge", mergeTraces, mergeProfile, "#ffba61")
            layout {
                title = "Disorder left after each layer"
                xaxis { title = "fraction of the network's layers applied" }
                yaxis { title = "inversions / most possible" }
                height = 480
            }
        }
        .darkMode(),
)
Faint lines are single permutations and bold lines the mean, with one marker per layer. Both networks reach zero at the right-hand edge, because that is what being a sorting network means. The horizontal axis stretches each network's layers over the same width, so the plot compares the shape of the two curves, not their length; bubble's extra layers show as its markers sitting closer together.
Odd-even merge does most of its work early: its first layer is the steepest step of either mean. Bubble barely moves at first, falls steeply through the middle, and clears the last inversions in its final layers.
One annealing run
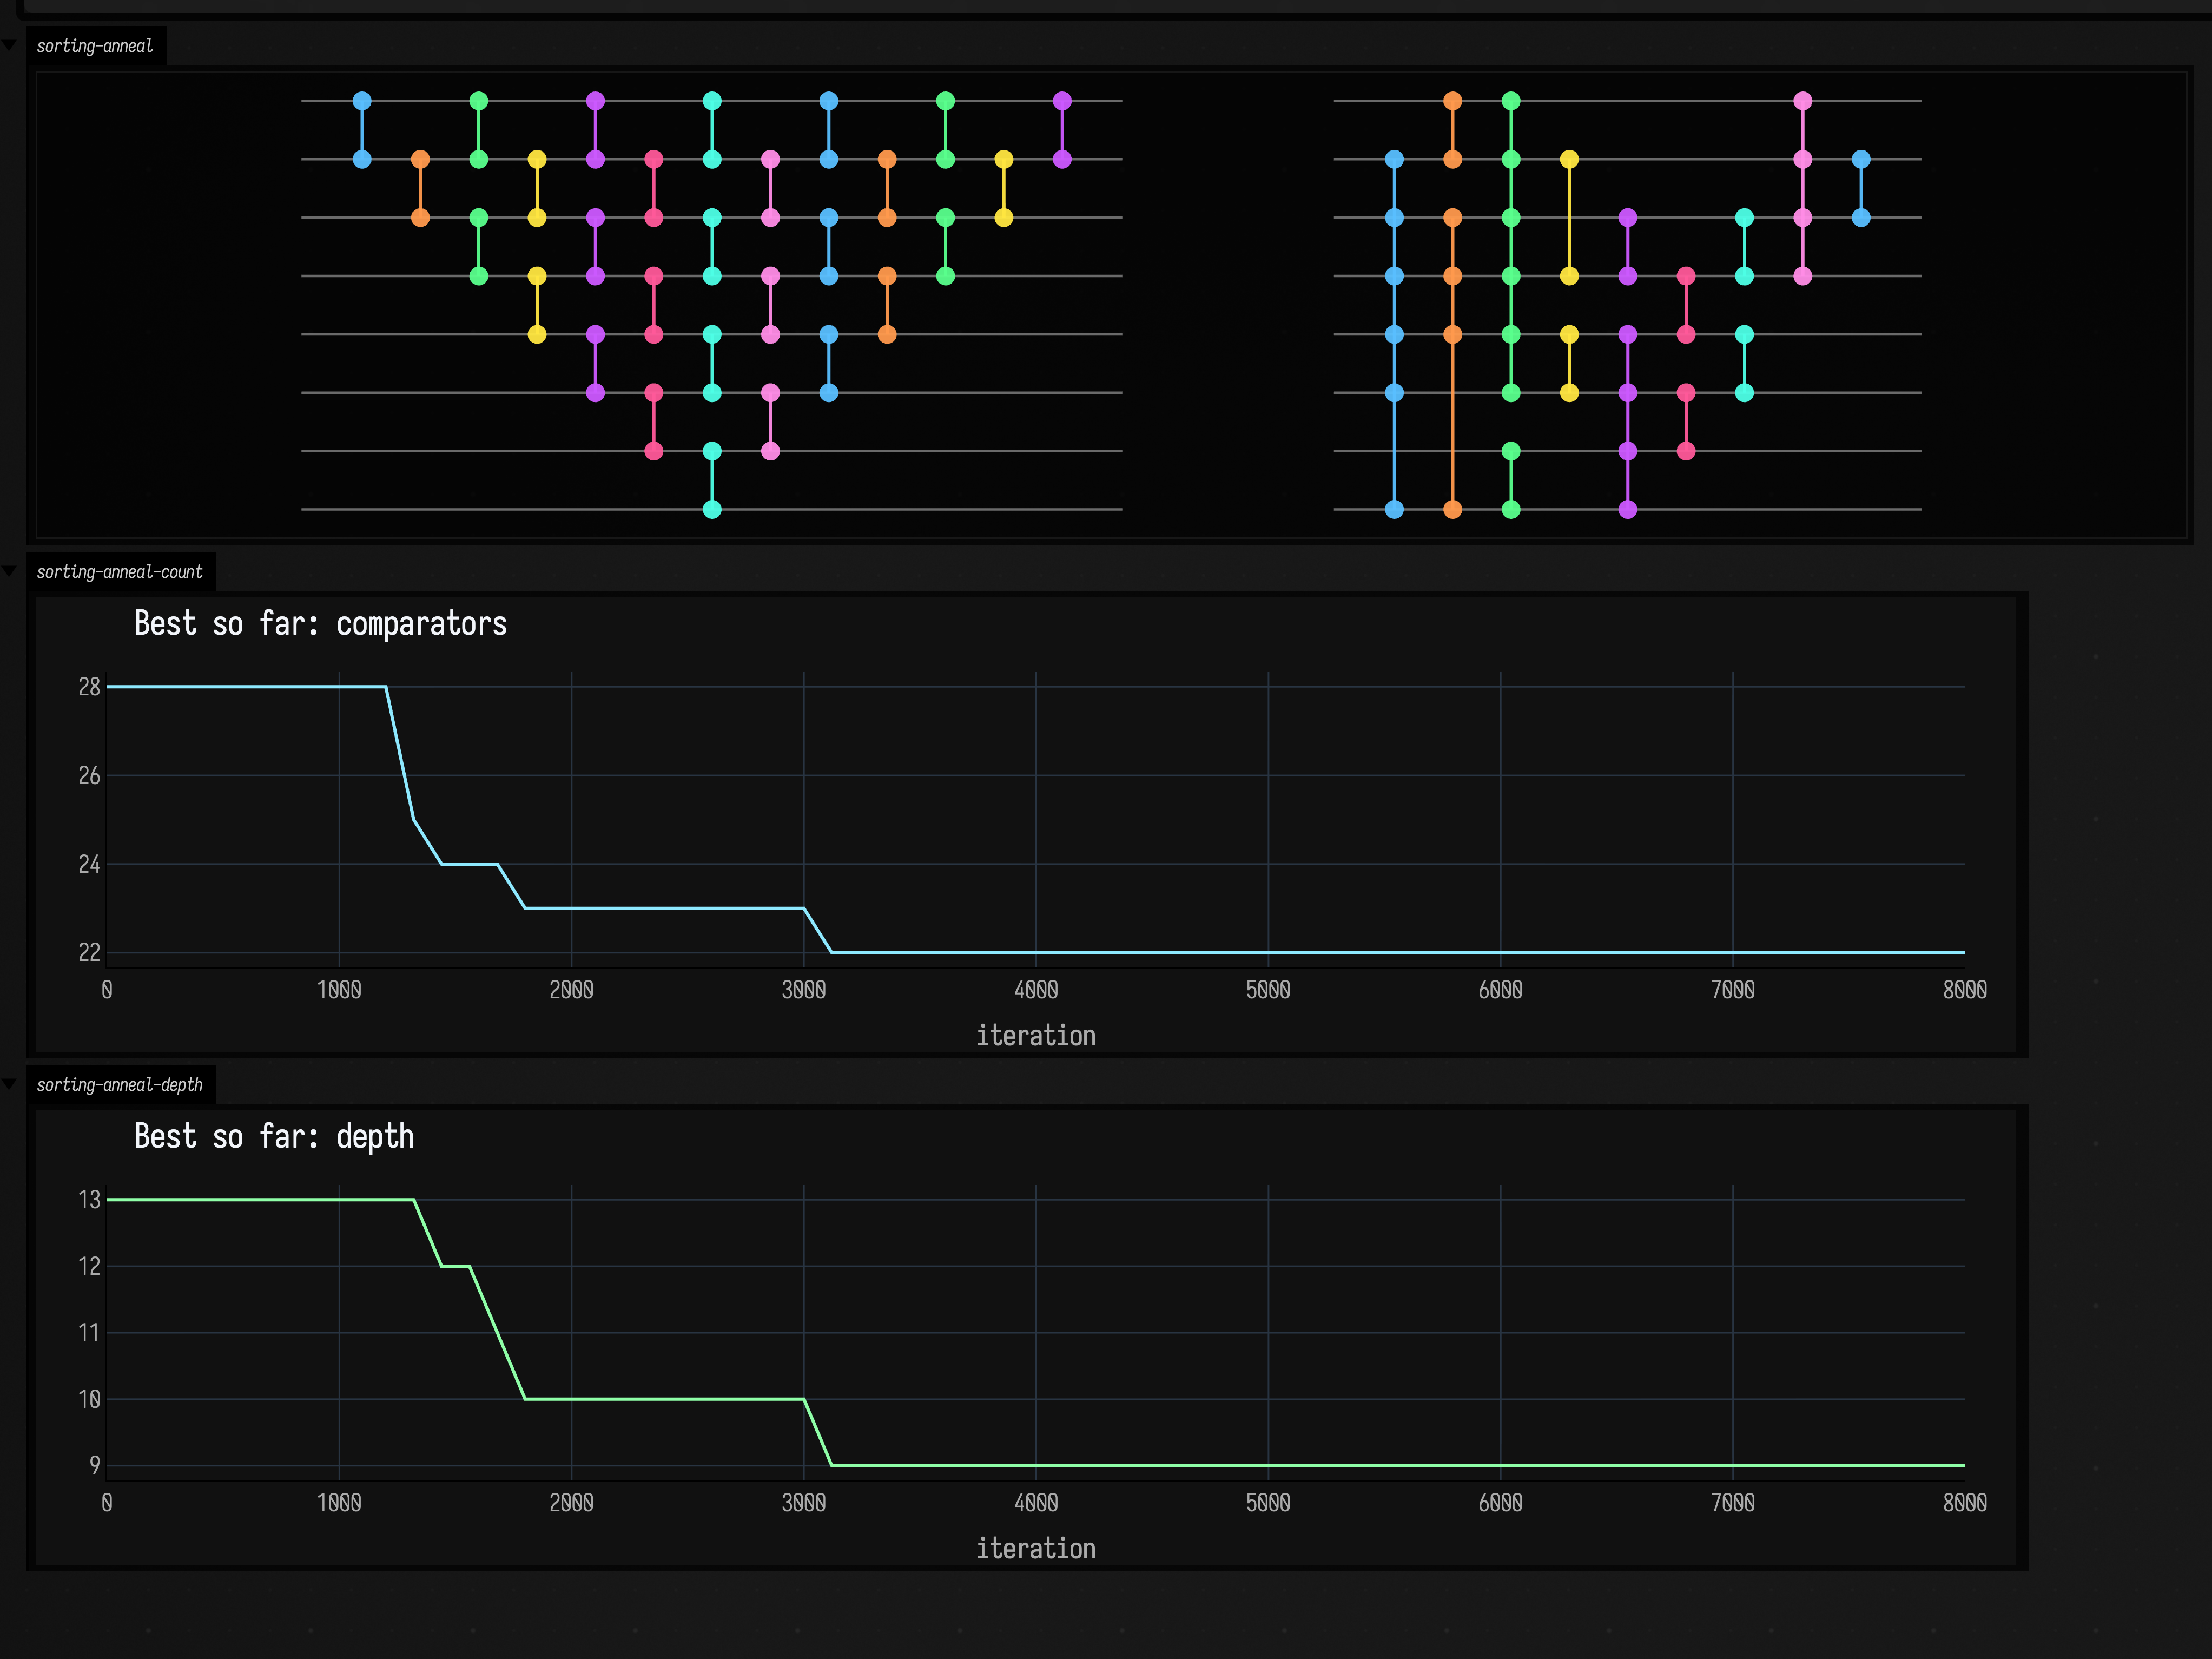
SortingNetwork.anneal(...) starts from a network and searches for a smaller one that still sorts. It reports the best network found so far through a callback, so this example can plot the whole run as well as draw the start and end networks.
:::static
import space.kscience.plotly.*
import space.kscience.plotly.models.ScatterMode

val baseline = SortingNetwork.bubble(8)
val history = mutableListOf<Pair<Int, SortingNetwork>>()

val best = SortingNetwork.anneal(
    n = 8,
    iterations = 8_000,
    seed = 7L,
    progressEvery = 120,
) { iter, net ->
        history += iter to net
    }

fun shift(lines: List<FLine>, dx: Double, dy: Double) = lines.map { it + vec(dx, dy, 0) }

// The starting network on the left, the one the search came back with on the right.
lines(
    shift(baseline.toFLines(wireSpacing = 26.0, layerSpacing = 26.0, margin = 28.0), 0.0, 0.0) +
        shift(best.toFLines(wireSpacing = 26.0, layerSpacing = 26.0, margin = 28.0), 460.0, 0.0),
    channel = "sorting-anneal",
    w = 1220.0,
    h = 300.0,
    fitToSize = true,
)

// The best network so far, measured two ways, against the iteration it was found at.
fun progress(title: String, hue: String, measure: (SortingNetwork) -> Int) =
    Plotly.plot {
            scatter {
                x.set(history.map { it.first })
                y.set(history.map { measure(it.second) })
                mode = ScatterMode.lines
                line {
                    color(hue)
                    width = 2.0
                }
            }
            layout {
                this.title = title
                xaxis { this.title = "iteration" }
                height = 280
                width = 1220
            }
        }
        .darkMode()

display("sorting-anneal-count", progress("Best so far: comparators", "#8ee9ff") { it.comparators.size })
display("sorting-anneal-depth", progress("Best so far: depth", "#8fffa8") { it.depth() })
Left is the bubble(8) network the search starts from, right is the network it came back with, and the two plots below are the comparator count and depth of the best network found so far. Both fall in a few steps early in the run and stay flat for the rest of it: the search finds its improvements early.
Comparing starting networks and schedules
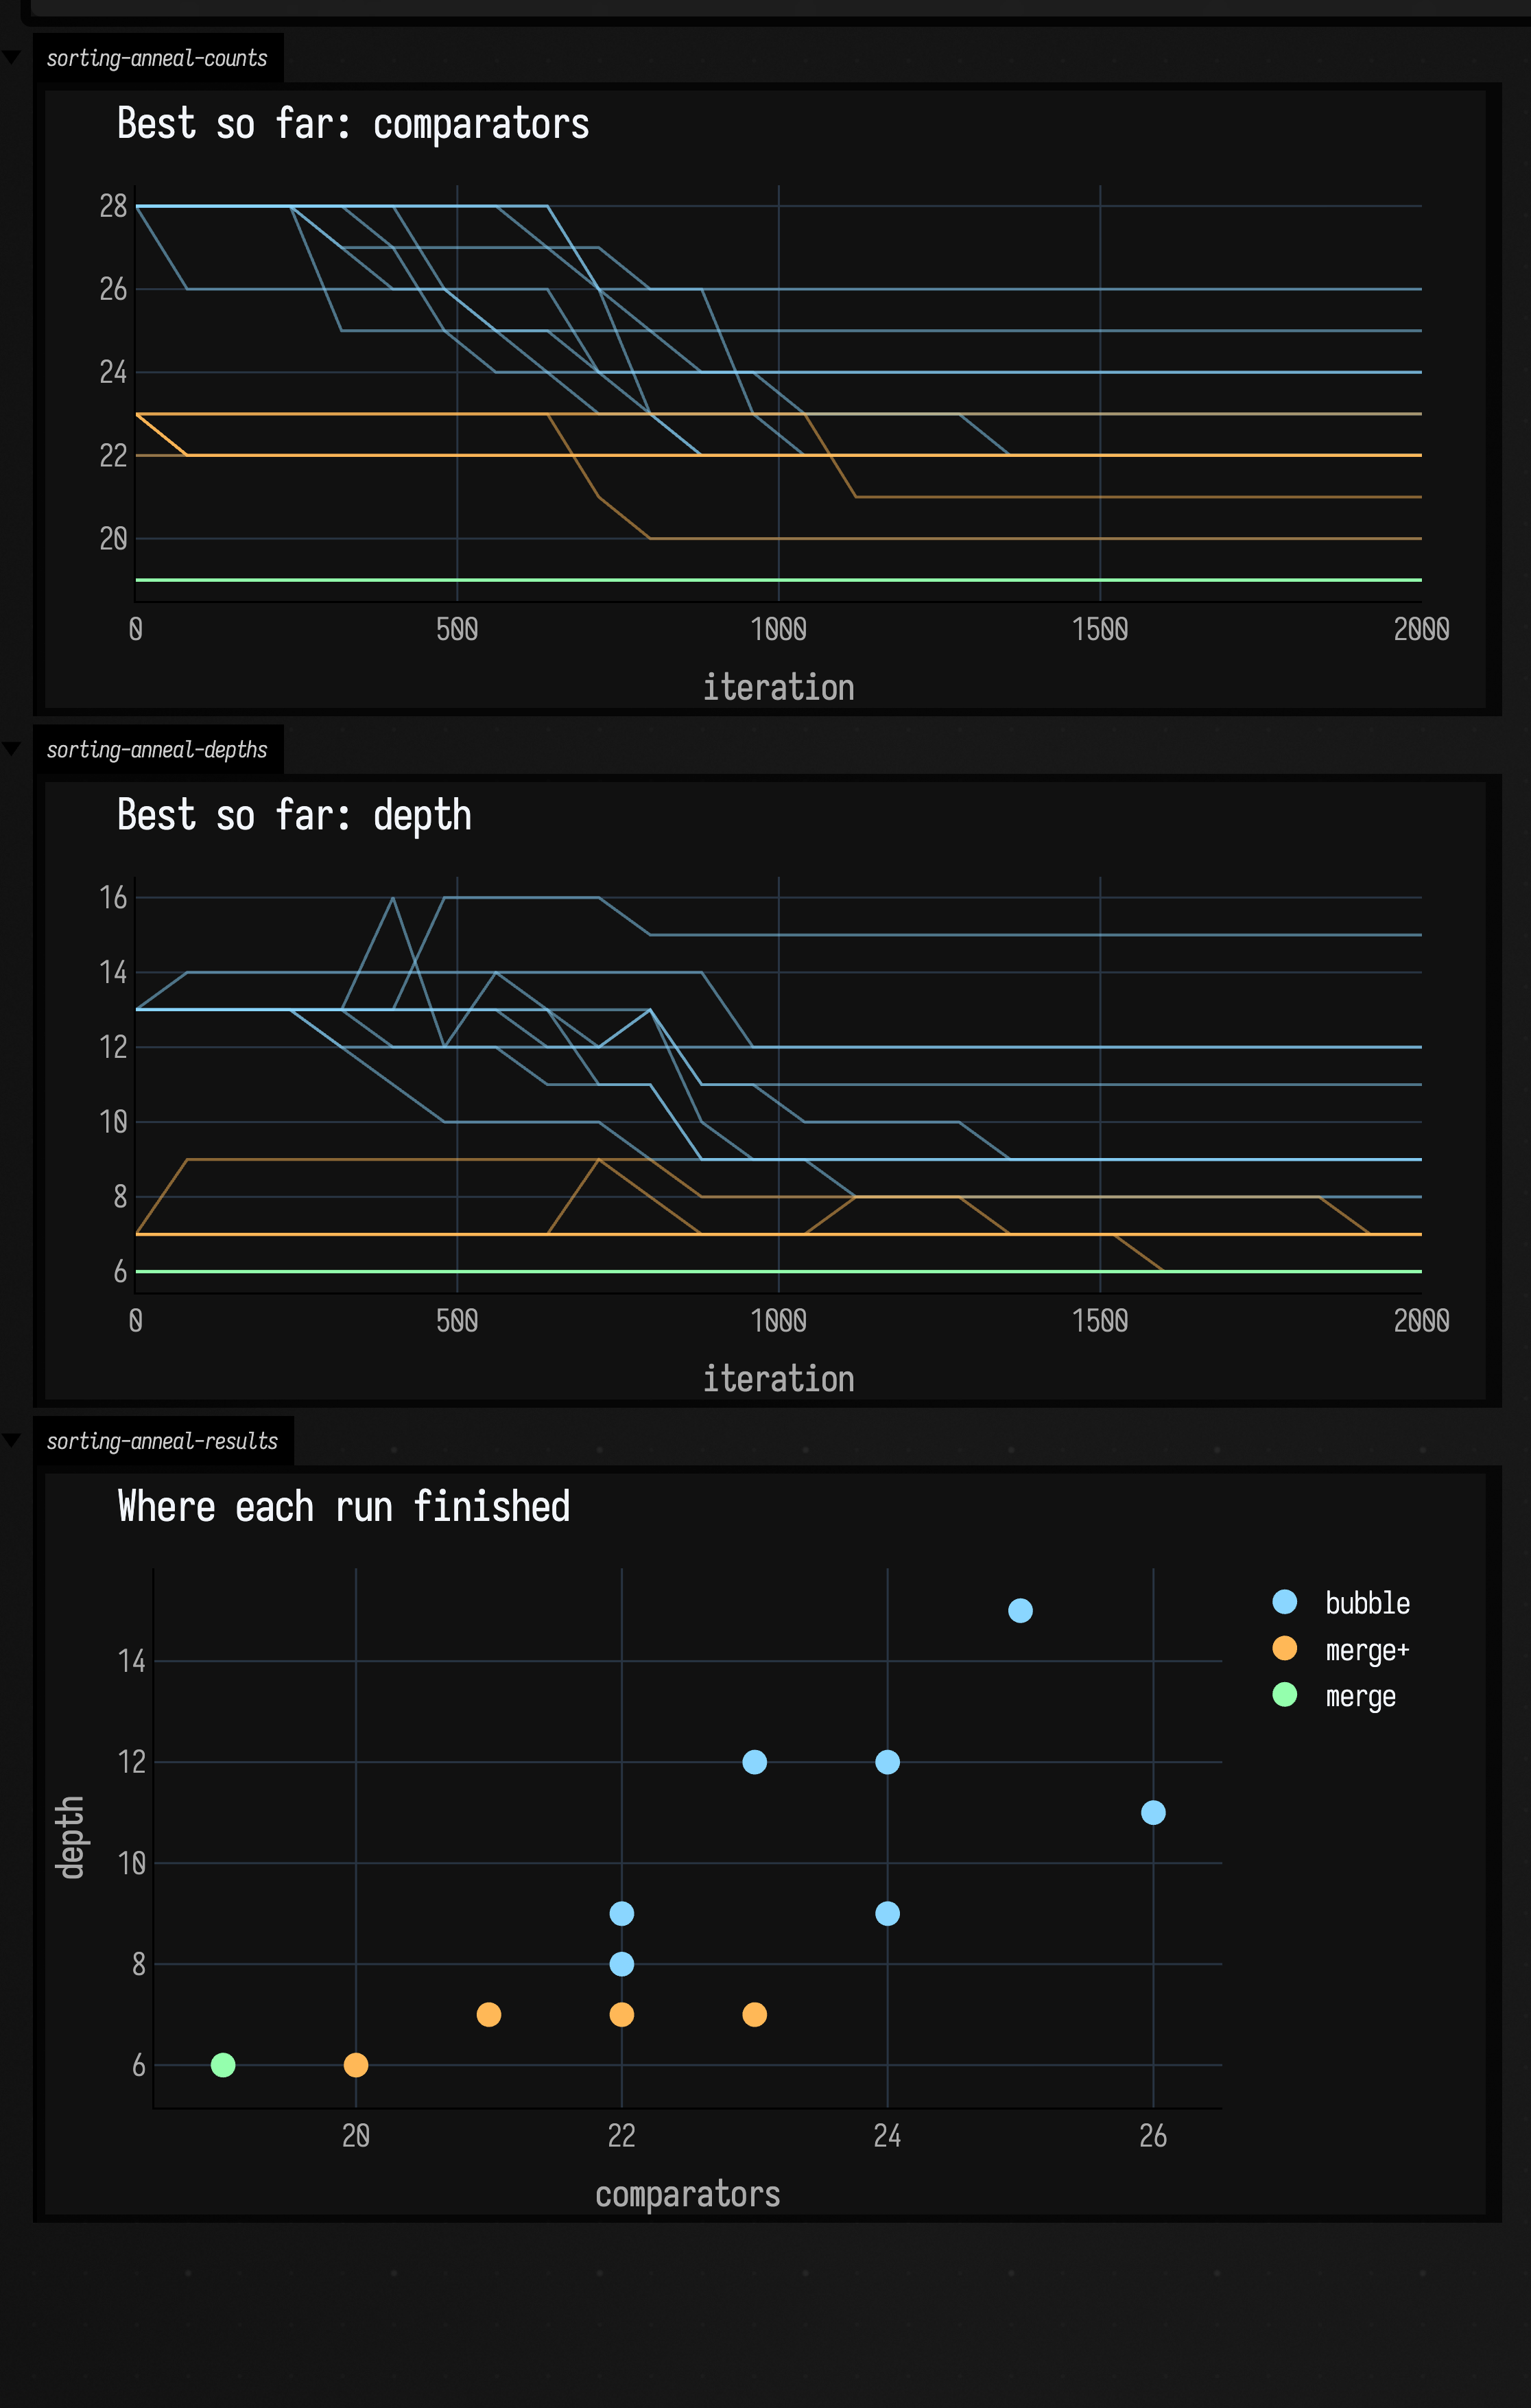
This example runs anneal over every combination of three starting networks, three temperature schedules and three random seeds, all on eight wires, and plots every run together with a scatter of where each one finished.
:::static
import space.kscience.plotly.*
import space.kscience.plotly.models.ScatterMode

:::fold a record for each run's settings and its traces
data class RunConfig(
    val family: String,
    val initial: SortingNetwork,
    val initialTemp: Double,
    val finalTemp: Double,
    val seed: Long,
    val hue: String,
)

data class RunResult(
    val config: RunConfig,
    val counts: List<Pair<Int, Double>>,
    val depths: List<Pair<Int, Double>>,
    val best: SortingNetwork,
)

:::endfold

val merge = SortingNetwork.oddEvenMerge(8)
val mergeDense = SortingNetwork(
    8,
    merge.comparators +
        listOf(
            SortingComparator(0, 1),
            SortingComparator(2, 3),
            SortingComparator(4, 5),
            SortingComparator(6, 7),
        ),
)

val configs =
    [
            Triple("bubble", SortingNetwork.bubble(8), "#8ad6ff"),
            Triple("merge+", mergeDense, "#ffb857"),
            Triple("merge", merge, "#94ffad"),
        ]
        .flatMapIndexed { familyIndex, (family, initial, hue) ->
            [0.7 to 0.05, 1.5 to 0.02, 3.2 to 0.01].flatMapIndexed { tempIndex, (startTemp, endTemp) ->
                (0 until 3).map { seed ->
                    RunConfig(
                        family = family,
                        initial = initial,
                        initialTemp = startTemp,
                        finalTemp = endTemp,
                        seed = (familyIndex * 100 + tempIndex * 10 + seed).toLong(),
                        hue = hue,
                    )
                }
            }
        }

val iterations = 2_000
val progressEvery = 80

val runs = configs.map { config ->
    val countTrace = mutableListOf<Pair<Int, Double>>()
    val depthTrace = mutableListOf<Pair<Int, Double>>()
    val best = SortingNetwork.anneal(
        n = 8,
        initialNetwork = config.initial,
        iterations = iterations,
        initialTemp = config.initialTemp,
        finalTemp = config.finalTemp,
        seed = config.seed,
        progressEvery = progressEvery,
    ) { iter, net ->
            countTrace += iter to net.comparators.size.toDouble()
            depthTrace += iter to net.depth().toDouble()
        }
    RunResult(
        config = config,
        counts =
            if (countTrace.lastOrNull()?.first == iterations) countTrace
            else countTrace + (iterations to best.comparators.size.toDouble()),
        depths =
            if (depthTrace.lastOrNull()?.first == iterations) depthTrace
            else depthTrace + (iterations to best.depth().toDouble()),
        best = best,
    )
}

// One faint line per run, coloured by its starting network.
fun traces(title: String, pick: (RunResult) -> List<Pair<Int, Double>>) =
    Plotly.plot {
            for (run in runs) scatter {
                x.set(pick(run).map { it.first })
                y.set(pick(run).map { it.second })
                mode = ScatterMode.lines
                line {
                    color(run.config.hue)
                    width = 1.4
                }
                opacity = 0.5
                showlegend = false
            }
            layout {
                this.title = title
                xaxis { this.title = "iteration" }
                height = 300
            }
        }
        .darkMode()

display("sorting-anneal-counts", traces("Best so far: comparators") { it.counts })
display("sorting-anneal-depths", traces("Best so far: depth") { it.depths })

// Where each run finished, one marker per run, grouped by starting network.
display(
    "sorting-anneal-results",
    Plotly.plot {
            for ((family, group) in runs.groupBy { it.config.family }) scatter {
                name = family
                x.set(group.map { it.best.comparators.size })
                y.set(group.map { it.best.depth() })
                mode = ScatterMode.markers
                marker {
                    size = 12
                    color(group.first().config.hue)
                }
            }
            layout {
                title = "Where each run finished"
                xaxis { title = "comparators" }
                yaxis { title = "depth" }
                height = 360
            }
        }
        .darkMode(),
)
The runs that start from oddEvenMerge(8) (green) are flat lines along the bottom, because that network already has the fewest comparators known for eight wires and there is nothing to remove; they all finish on the same point of the scatter. merge+ (orange) is the same network with four of its first-layer comparators repeated, which makes those four copies useless, and its runs finish at different places depending on how many copies each one removed. The runs that start from bubble (blue) wander down through the first half and finish up and to the right, without reaching the depth of either merge network.
The scatter puts comparator count across the page and depth up it. Where a run finishes depends far more on the network it starts from than on its temperature schedule.
For more fixed structure with plotted behaviour, continue with Graph connectivity examples and Boolean networks examples.
The public declarations used on this page are listed, with their KDoc, in the codebase reference: sorting_networks.kt. Start from what's already in the box.