Vectorizing line drawings: polyvector fields
Polyvector.vectorize turns a scanned sketch into curves, tracing the middle of each stroke and
trying to follow it through crossings and T-junctions. The method is Bessmeltsev and Solomon's Vectorization of Line Drawings via Polyvector
Fields (ACM Transactions on Graphics, 2019), and Field runs the authors' own implementation.
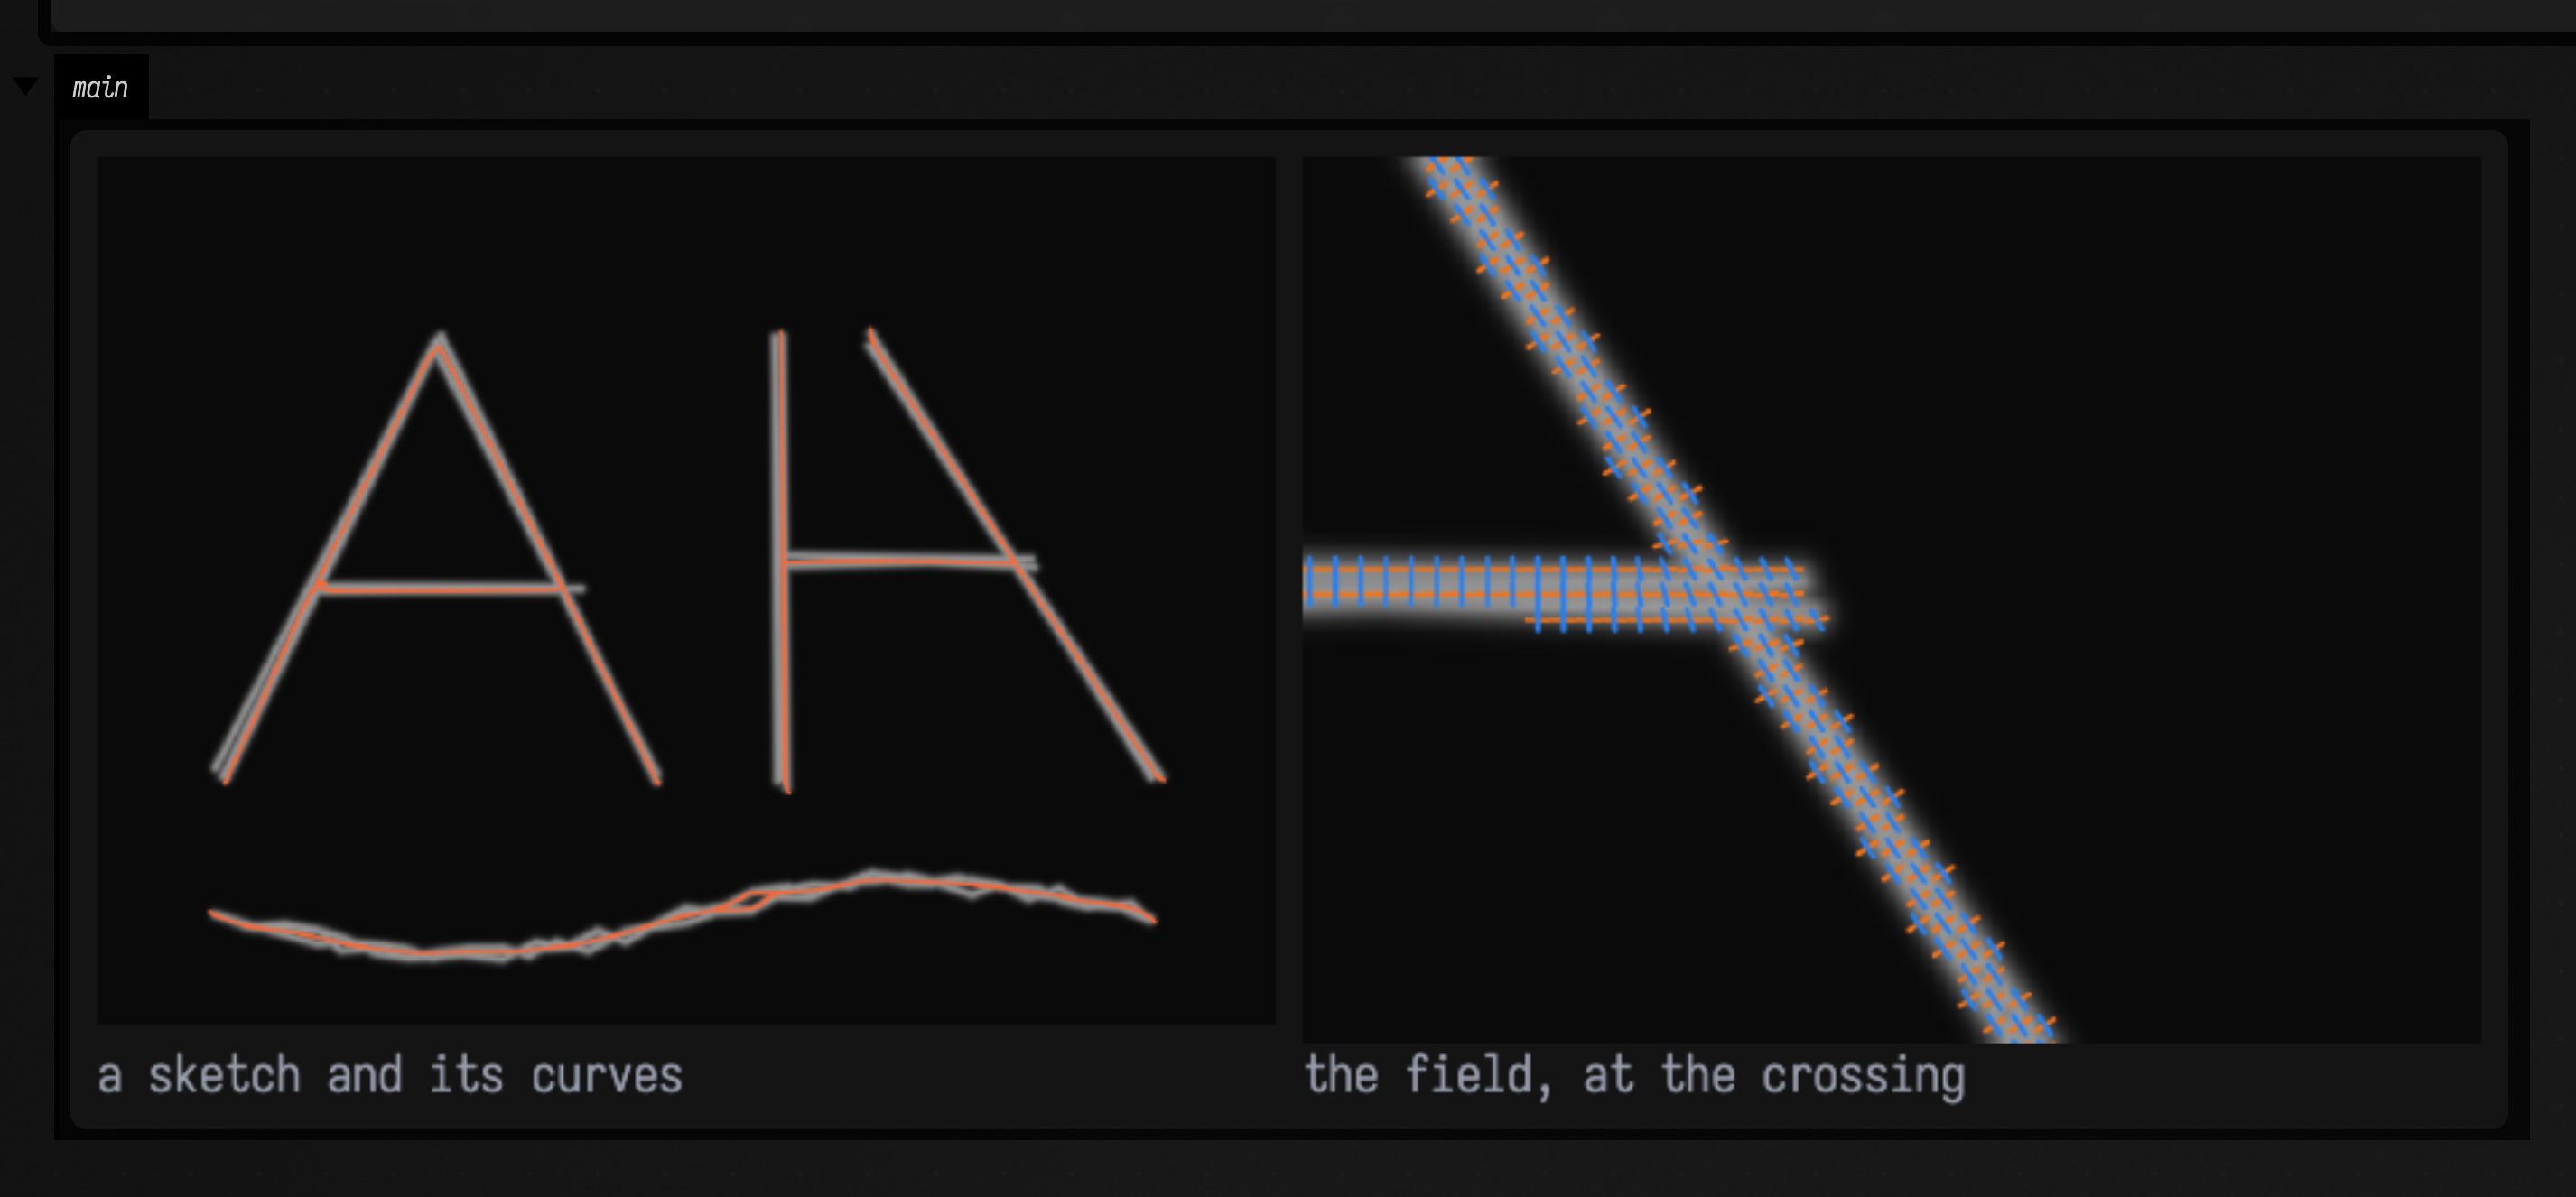
The idea that makes it work at crossings is the polyvector field. At every inked pixel it holds two directions instead of one. Along a single stroke they are the stroke's direction and one across it. Where two strokes cross they are the two strokes' directions, so a curve traced along the field carries on through the crossing instead of turning down the other stroke.
This example draws a sketch the way a hand would, laying every stroke down three times with a little wobble, then vectorizes it. On the right is the field near the crossing, magnified: an orange and a blue tick at every other ink pixel.
import afield.geometry.vectorize.polyvector.*

// A sketch, drawn the way a hand would: each stroke laid down three times with a little wobble, in a
// soft pencil line about three pixels wide.
val random = java.util.Random(3)
val strokes = [
    [Vec2(40f, 200f), Vec2(110f, 60f), Vec2(180f, 200f)], // an A
    [Vec2(70f, 140f), Vec2(150f, 140f)], // its crossbar
    [Vec2(220f, 60f), Vec2(220f, 200f)], // a post
    [Vec2(220f, 130f), Vec2(300f, 130f)], // meeting a beam: a T
    [Vec2(250f, 60f), Vec2(340f, 200f)], // and a stroke crossing it: an X
    (0..30).map { Vec2(40f + 300f * it / 30, (245 + 12 * sin(it / 30.0 * 2 * PI)).toFloat()) }, // a wave
]
val w = 380
val h = 280
val ink = FloatArray(w * h)
for (stroke in strokes) repeat(3) {
    val jitter = { random.nextGaussian().toFloat() * 1.5f }
    val pts = stroke.map { Vec2(it.x + jitter(), it.y + jitter()) }
    for (k in 0 until pts.size - 1) {
        val a = pts[k]
        val b = pts[k + 1]
        val n = (a.distance(b) * 2).toInt()
        for (s in 0..n) {
            val t = s.toFloat() / n
            val cx = a.x + (b.x - a.x) * t
            val cy = a.y + (b.y - a.y) * t
            for (y in (cy - 4).toInt()..(cy + 4).toInt()) for (x in (cx - 4).toInt()..(cx + 4).toInt()) {
                if (x !in 0 until w || y !in 0 until h) continue
                val d = hypot(x + 0.5 - cx, y + 0.5 - cy) / 1.6
                ink[y * w + x] = maxOf(ink[y * w + x], (0.8 * exp(-d * d)).toFloat())
            }
        }
    }
}
val drawing = Img(w, h, 3, FloatArray(w * h * 3) { 1f - ink[it / 3] })

val field = Polyvector.fitField(Polyvector.inkOf(drawing))
val result = field.trace()

// Shown light on black: the same pencil marks, inverted for display only.
val pencil = Img(w, h, 3, FloatArray(w * h * 3) { 0.04f + 0.7f * ink[it / 3] })
val curveColor = Vec4(1f, 0.4f, 0.2f, 1f)
// The field near the X, magnified, moved into the crop's coordinates.
val x0 = 262
val y0 = 96
val shift = Vec2(-x0.toFloat(), -y0.toFloat())
showImgGrid(
    "a sketch and its curves" to pencil.drawFLines(result.toFLines(color = curveColor, thickness = 2.0), scale = 2.0),
    "the field, at the crossing" to
        pencil
            .crop(x0, y0, 93, 70)
            .drawFLines(field.directionFLines(step = 2, length = 1.7, thickness = 3.0).map { it + shift }, scale = 8.0),
    columns = 2,
    cellSide = 440,
)
Polyvector.vectorize(drawing) does both steps for a dark-on-light drawing. Above they are separate:
Polyvector.inkOf(drawing) turns the drawing into evidence, an image where 1 is ink and 0 is paper.
fitField builds the field, and trace() reads curves off it. toFLines() gives one FLine per
curve, in pixel coordinates.
The library is optional
Polyvector vectorization comes from a native library, field_polyvector, which Field does not need
in order to run. It needs OpenCV, Boost and Eigen: brew install opencv boost eigen on macOS,
sudo apt install libopencv-dev libboost-dev libeigen3-dev on Debian and Ubuntu. Then build it
once with ./gradlew buildPolyvectorNative, which downloads the authors' code at a fixed
version. The welcome page's Geometry extensions panel shows whether it is built and how to
build it on your system, and ./field.sh --setup can install the packages and build it for you.
Windows is not supported yet.
From pixels to geometry
What comes out is a set of curves, each an ordinary FLine that you can
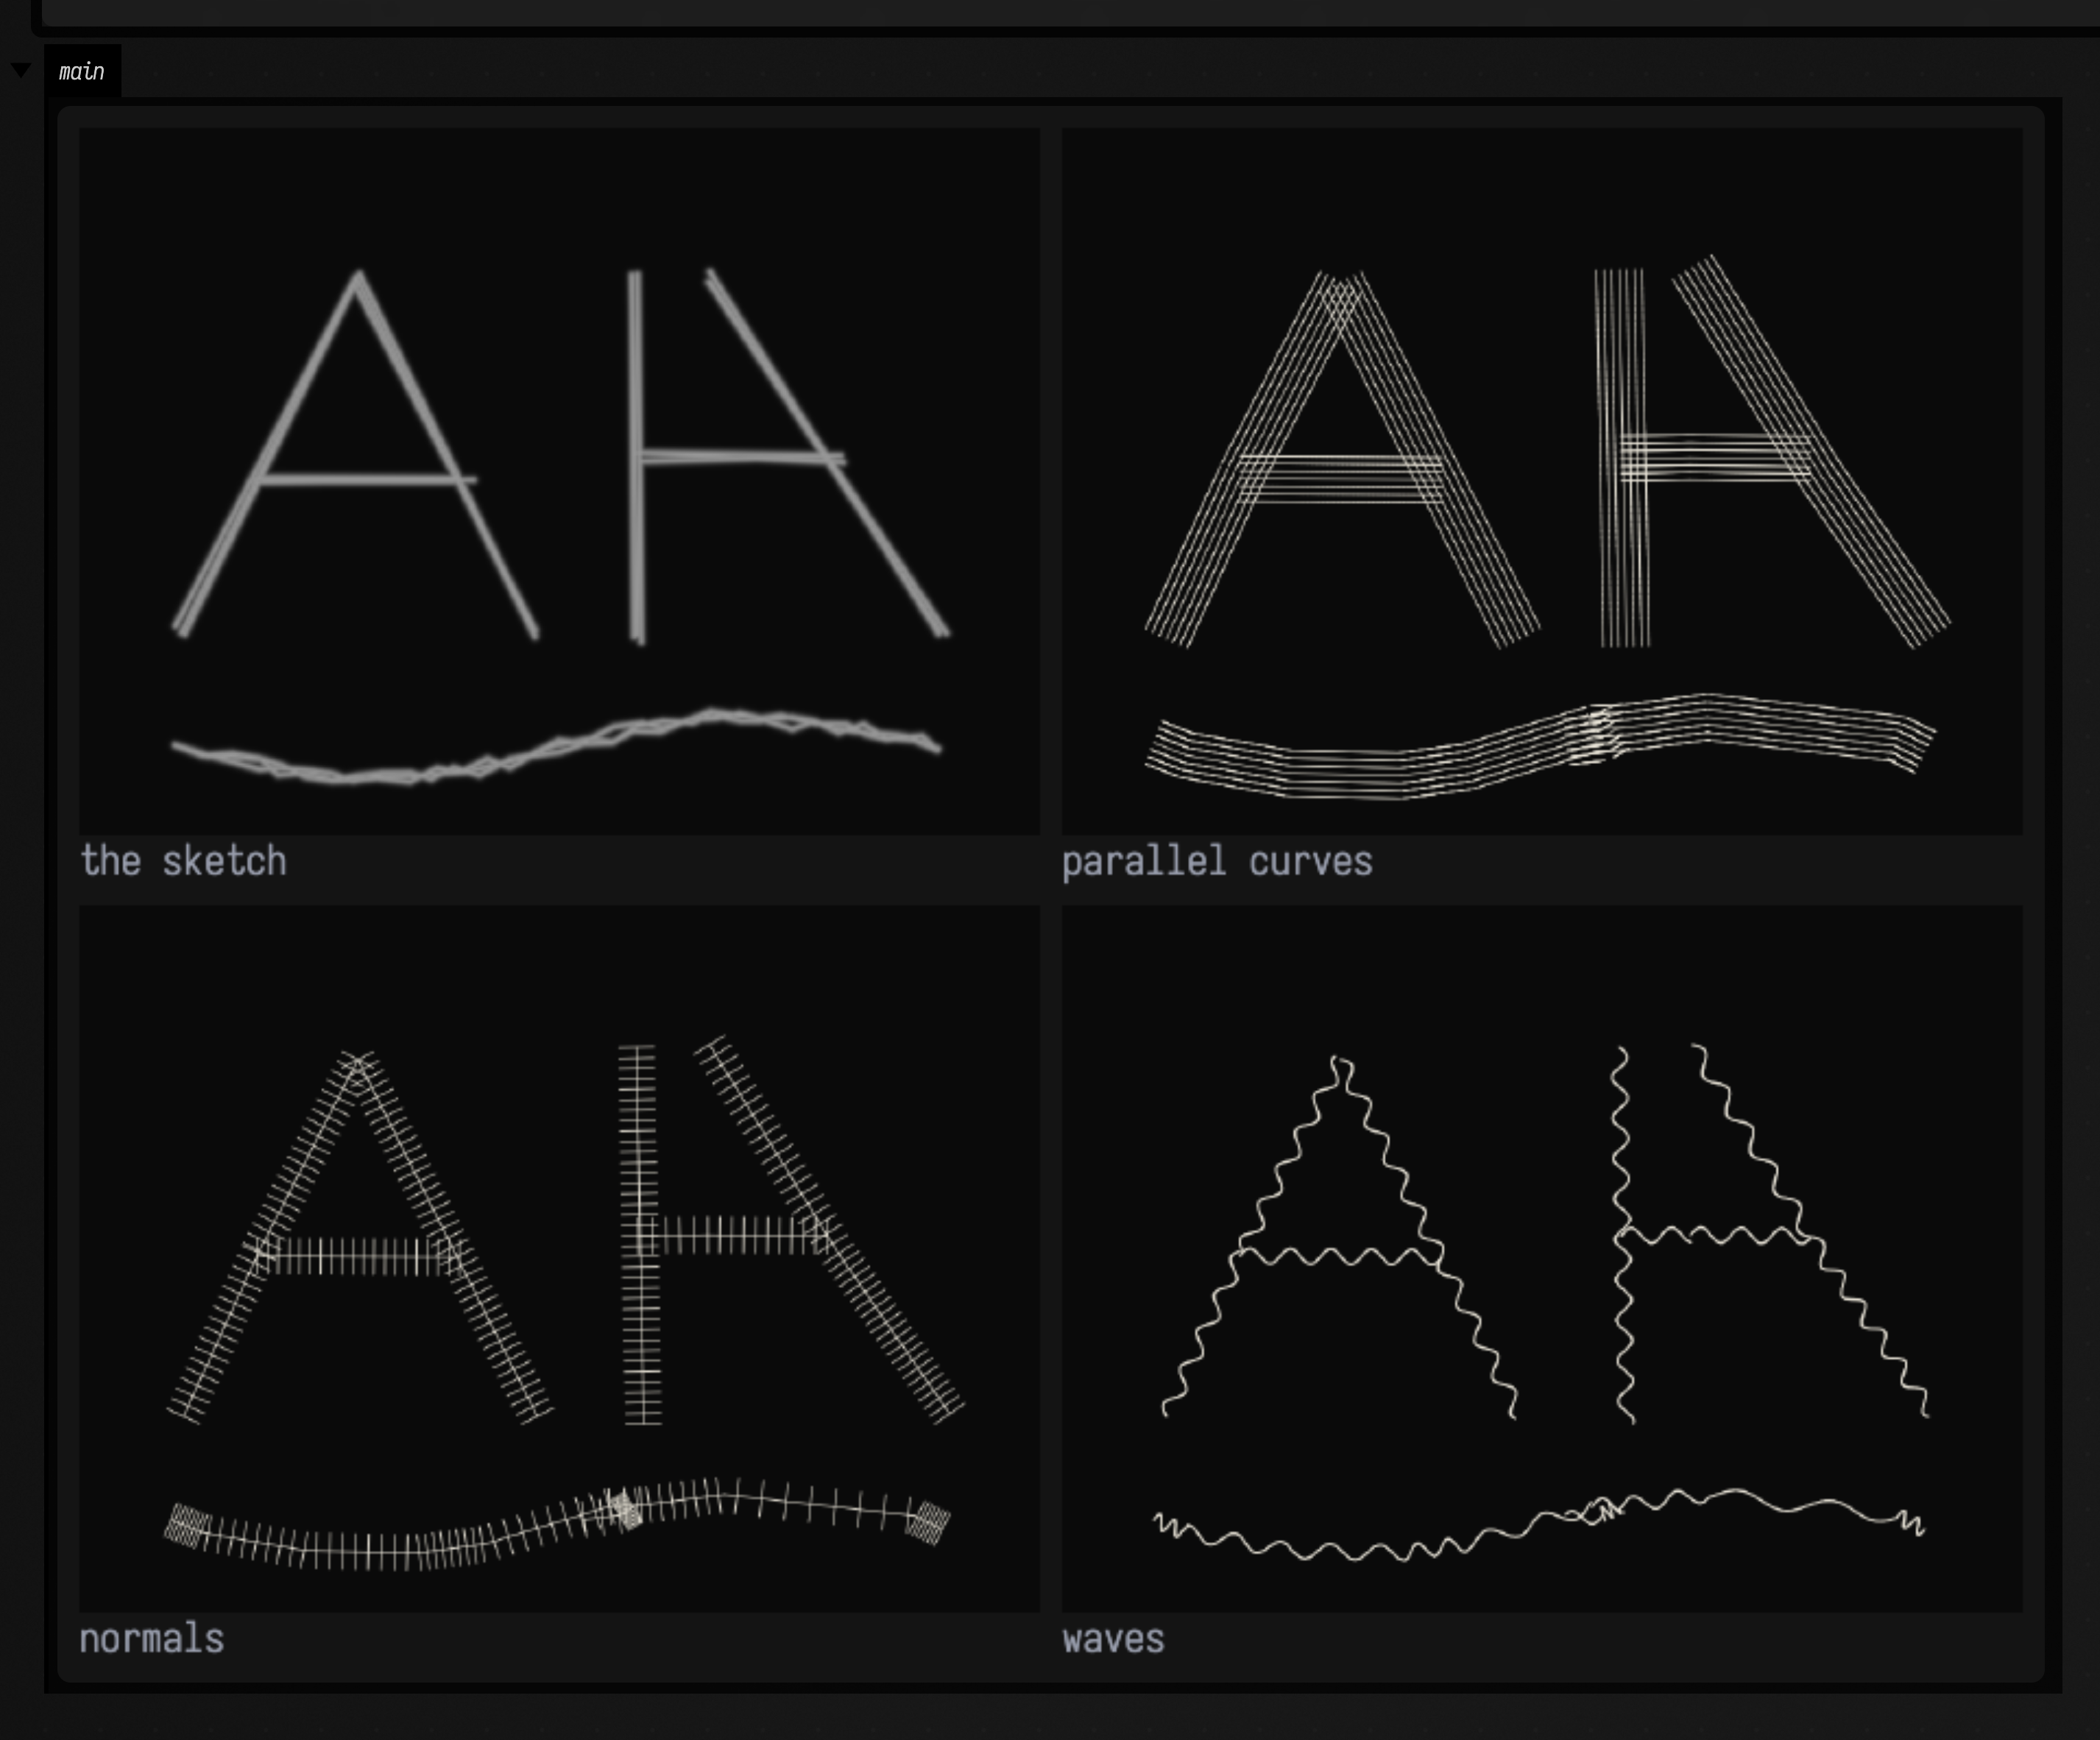
measure, offset, resample, warp or extrude like any other Field geometry. This example vectorizes the
same sketch, drops any fragment shorter than 12 pixels, and then gives the curves three treatments
that would be awkward to do to the pixels: parallel outlines, a comb of normals, and a wave.
import afield.geometry.vectorize.polyvector.*

:::fold the same sketch as above
// A sketch, drawn the way a hand would: each stroke laid down three times with a little wobble, in a
// soft pencil line about three pixels wide.
val random = java.util.Random(3)
val strokes = [
    [Vec2(40f, 200f), Vec2(110f, 60f), Vec2(180f, 200f)], // an A
    [Vec2(70f, 140f), Vec2(150f, 140f)], // its crossbar
    [Vec2(220f, 60f), Vec2(220f, 200f)], // a post
    [Vec2(220f, 130f), Vec2(300f, 130f)], // meeting a beam: a T
    [Vec2(250f, 60f), Vec2(340f, 200f)], // and a stroke crossing it: an X
    (0..30).map { Vec2(40f + 300f * it / 30, (245 + 12 * sin(it / 30.0 * 2 * PI)).toFloat()) }, // a wave
]
val w = 380
val h = 280
val ink = FloatArray(w * h)
for (stroke in strokes) repeat(3) {
    val jitter = { random.nextGaussian().toFloat() * 1.5f }
    val pts = stroke.map { Vec2(it.x + jitter(), it.y + jitter()) }
    for (k in 0 until pts.size - 1) {
        val a = pts[k]
        val b = pts[k + 1]
        val n = (a.distance(b) * 2).toInt()
        for (s in 0..n) {
            val t = s.toFloat() / n
            val cx = a.x + (b.x - a.x) * t
            val cy = a.y + (b.y - a.y) * t
            for (y in (cy - 4).toInt()..(cy + 4).toInt()) for (x in (cx - 4).toInt()..(cx + 4).toInt()) {
                if (x !in 0 until w || y !in 0 until h) continue
                val d = hypot(x + 0.5 - cx, y + 0.5 - cy) / 1.6
                ink[y * w + x] = maxOf(ink[y * w + x], (0.8 * exp(-d * d)).toFloat())
            }
        }
    }
}
val drawing = Img(w, h, 3, FloatArray(w * h * 3) { 1f - ink[it / 3] })
:::

// Vectorize, simplify away the pencil's jitter (2 pixels), and keep curves at least 12 pixels long.
val curves = Polyvector.vectorize(drawing).toFLines().map { it.bySimplifying(2f) }.filter { it.length() > 12f }

// From here on the drawing is geometry: FLines, which anything that works on FLines works on.
// (byWaving's frequency is per node interval; this asks for one wave every 16 pixels.)
val light = Vec4(0.92f, 0.9f, 0.85f, 1f)
fun styled(lines: List<FLine>, thickness: Double) = lines.onEach {
    it.color = light
    it.thickness = thickness
}
val engraved =
    styled(curves.flatMap { c -> [c] + [3f, 6f, 9f].flatMap { d -> c.byCreatingParallelCurves(d, 120).toList() } }, 1.0)
val combed = styled(
    curves.flatMap { c ->
        [c] + c.byCreatingNormalLines(samples = (c.length() / 4).toInt().coerceAtLeast(2), length = 14f)
    },
    1.0,
)
val waved = styled(
    curves.map {
        it.byWaving(
            amplitude = 3f,
            frequency = it.length() / 16f / (it.nodes.size - 1),
            samples = (it.length() * 2).toInt().coerceAtLeast(20),
        )
    },
    1.6,
)

val black = Img(w, h, 3, FloatArray(w * h * 3) { 0.04f })
val pencil = Img(w, h, 3, FloatArray(w * h * 3) { 0.04f + 0.7f * ink[it / 3] })
showImgGrid(
    "the sketch" to pencil.drawFLines(emptyList(), scale = 2.0),
    "parallel curves" to black.drawFLines(engraved, scale = 2.0),
    "normals" to black.drawFLines(combed, scale = 2.0),
    "waves" to black.drawFLines(waved, scale = 2.0),
    columns = 2,
    cellSide = 440,
)
bySimplifying is ordinary FLine geometry too: it drops points that stray less than 2 pixels from
the line through their neighbours. Every line also carries
curveId, startNode and endNode in its properties, and the GeometryNetwork it came from,
so a manipulated copy can still be traced back to the stroke it came from.
Photographs: evidence first
A photograph is not a line drawing, so it needs line evidence first: any image where the lines you
want are bright and everything else is dark. Edge and ridge detectors produce exactly that.
fitField takes the evidence directly, so you choose what counts as a line. This example uses
the gradient magnitude of the leaf print's brightness, so every edge in the photograph becomes a
soft bright line, and vectorizes it:
import afield.geometry.vectorize.polyvector.*

// The leaf print's edges, as the gradient magnitude of its slightly blurred brightness, scaled so
// the strongest 2% of edges are 1.
val print = imgFromFile("public/docs/assets/vision/fline-viewer.jpg", 3).crop(78, 262, 128, 236).scaleBy(2.0)
val edges = print.luma().gaussianBlur(1.2).sobel().magnitude()
val strongest = edges.data.sortedDescending()[edges.data.size / 50]
val evidence =
    Img(edges.width, edges.height, 1, FloatArray(edges.data.size) { (edges.data[it] / strongest).coerceIn(0f, 1f) })

val result = Polyvector.fitField(evidence).trace()
val dark = Img(print.width, print.height, 3, FloatArray(print.width * print.height * 3))
showImgGrid(
    "photograph" to print,
    "edge evidence" to evidence,
    "curves" to print.overlay(dark, 0.55).drawFLines(result.toFLines(thickness = 1.5)),
    columns = 3,
    cellSide = 320,
)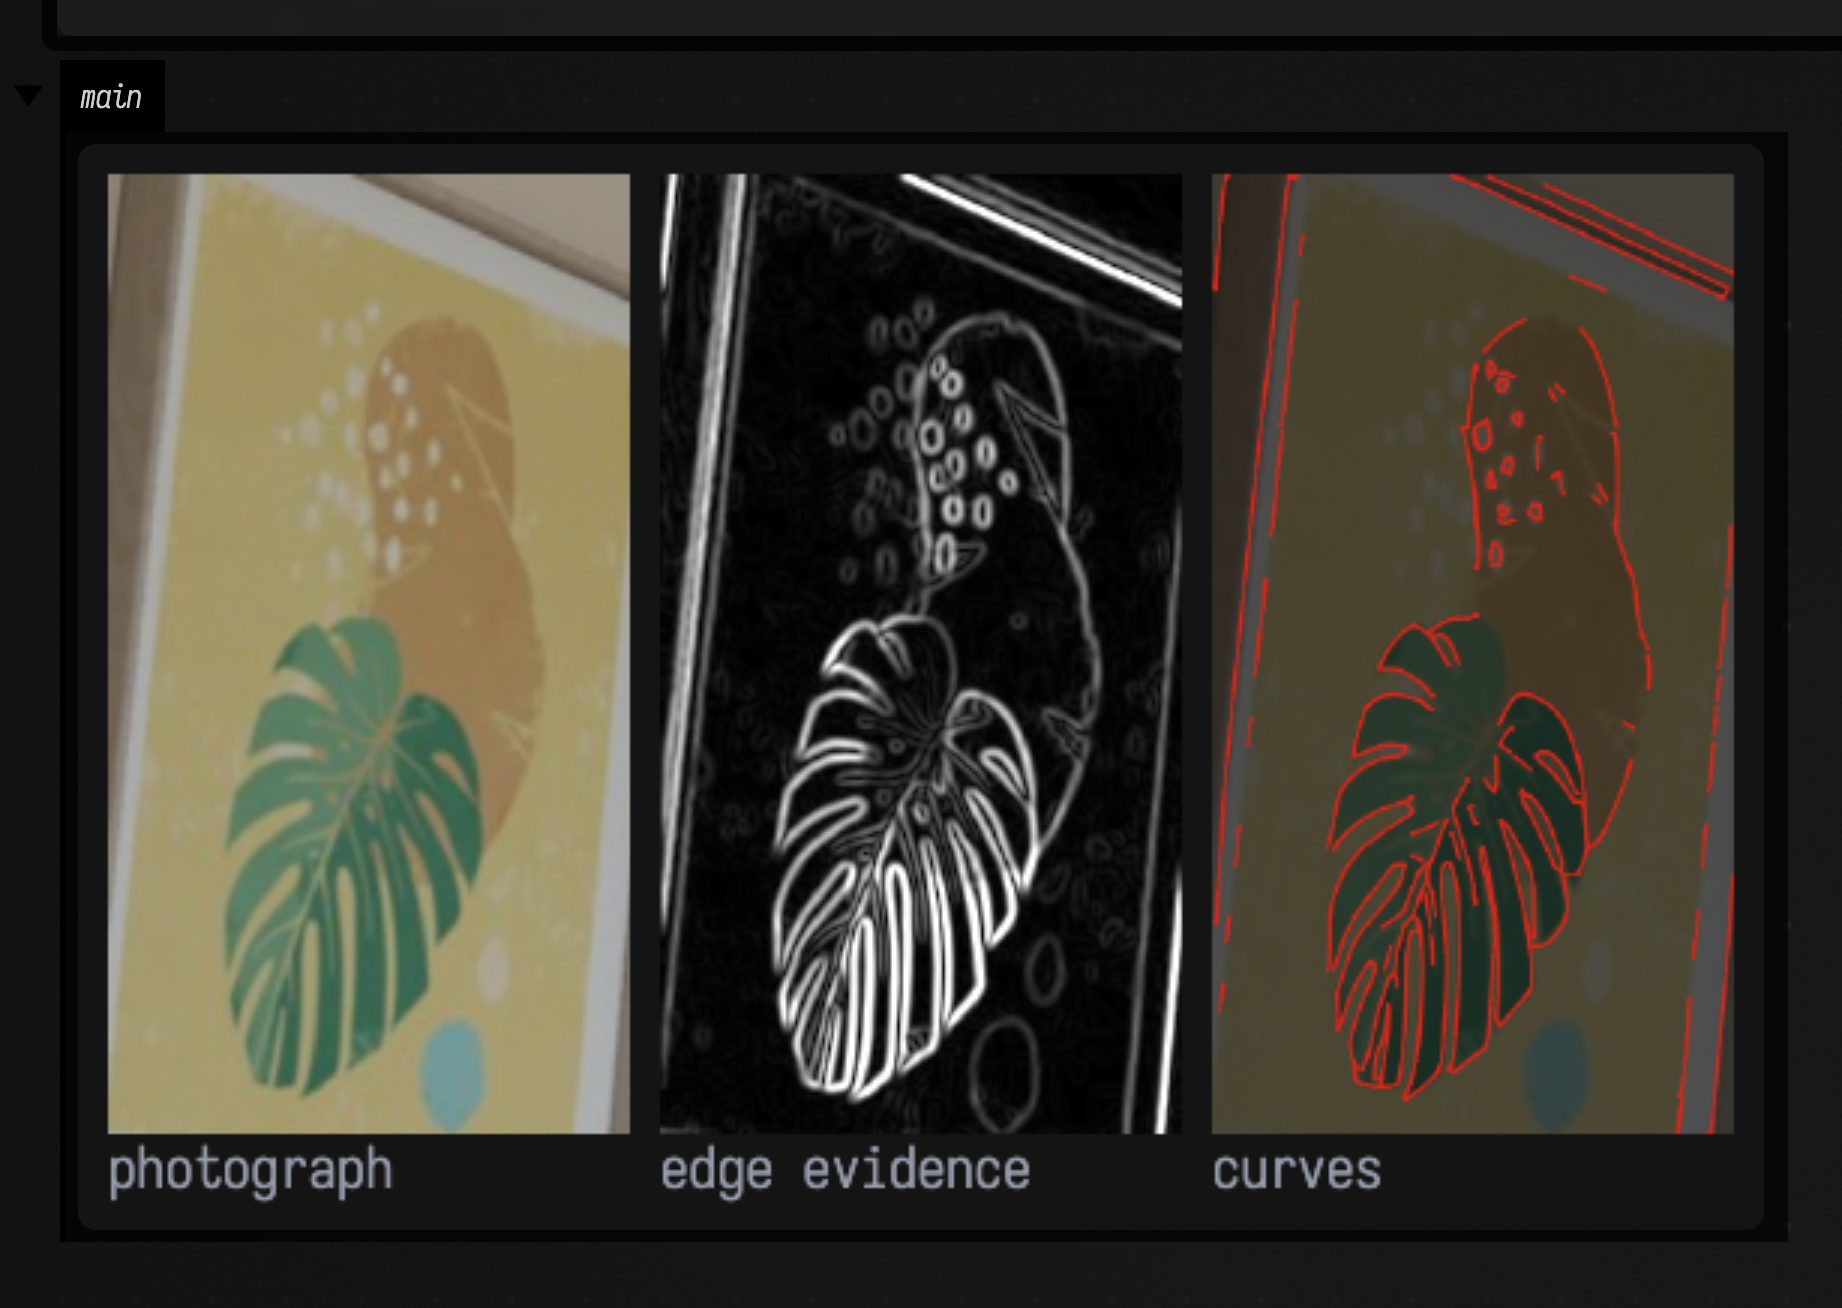
Each edge of a stroke in the photograph becomes its own curve, so a dark band gives two parallel curves, one along each side. To get one curve down the middle of a band, use evidence that is bright inside the band, such as its darkness, instead of evidence that is bright along its edges.
An edge map holds far more ink than a drawing, and this example takes over a minute to trace. For
anything large, run it off the box's thread with Polyvector.vectorizeAsync and runAsync.
What the result holds
A field is built once and can be traced as often as you like: field.trace(TraceParameters(...))
reuses it. Everything is plain Kotlin data.
field.mask |
1 where the evidence counts as ink. |
field.directions |
the two field directions at every pixel (x0, y0, x1, y1), zero off the ink. field.directionFLines() draws them as ticks. |
field.weight |
how confident the method is, per pixel, that one direction dominates. |
field.singularities |
points where the field cannot be continued smoothly; singularitiesFLine() draws them. |
result.curves |
the final curves, as x, y float arrays in pixels. |
result.streamlines |
the lines traced along the field before they were grouped into curves; streamlinesFLine() draws them. |
result.network() |
the curves as a GeometryNetwork. A node is made only where curve ends meet, and each curve vertex carries the evidence under it. |
result.coverage() |
the share of ink pixels within a stroke width of some curve: 1 means every inked pixel is explained, and a dropped stroke lowers it. meanStrokeWidth is the width it uses. |
FrameFieldParameters sets the ink threshold and the field's smoothness. TraceParameters sets how
readily short side branches are pruned, which small holes are closed over, and the final smoothing.
The defaults are the authors'.
Which drawings it suits
The method was designed for, and tested on, scanned pencil and ink drawings with strokes a few pixels wide. On those it reproduces the authors' published results exactly. Outside that range:
- Strokes much wider than about four pixels can lose the stem of a T-junction. Scaling the image down does not reliably fix this.
- Perfectly crisp, computer-drawn strokes (pure black on white, no grey edge) are harder for it than pencil: a thin one can be dropped and a wider one traced as two parallel curves. Blurring the image slightly first helps.
- It is not fast. A drawing of a few hundred pixels takes seconds to a minute, and only one vectorization runs at a time in a Field process.
Agents: how this is checked
tools/validate_polyvector.py builds the authors' command-line program from the same pinned
commit and runs it and Field's library on the authors' six sample drawings: the curves are
identical point for point. Getting there turned up two places where the first port differed: the
ink threshold, which became 89.99999 instead of 90 on the way through 0..1, and a loop condition
that compares a signed with an unsigned count, so it repeats whenever the number of
singularities changes, not only when it falls. Both now match the original. The native test
(native/field-polyvector/tests/) pins one of those drawings to the reference's numbers and
checks the crossing, T-junction, parallel-stroke and separate-component cases. The samples
themselves are not in Field's repository, because they are someone else's copyrighted drawings;
the build fetches them with the source.