Neighbours and graphs on a point cloud
Start with a cloud of points. Which ones are close to you? Join each point to a few neighbours and another question appears: can you get from one side of the cloud to the other? Change how you draw the edges and the answer can change too. We'll draw the searches, connections and routes as we go.
Query neighborhood with exact and approximate search
"Nearby" is three different questions. The closest k things is a question about
rank; everything inside a radius is a question about density; and an approximate
answer to either is a question about how much error buys how much speed. The
fence below asks all three of the same cloud.
:::static
val points = List(220) {
    vec(80.0 + random() * 900.0, 70.0 + random() * 550.0)
}

val exact = vec2NN(points, mode = VecNNMode.EXACT)
val approx = vec2NN(points, mode = VecNNMode.APPROXIMATE)

val q = vec(530.0, 340.0)
val kExact = exact.kNearest(q, 10)
val kApprox = approx.kNearest(q, 10)
val radius = exact.withinRadius(q, 140.0)

val cloud = fline {
    points.forEach { p -> moveTo(p.x, p.y) }
    pointed = true
    pointSize = 3.0
    stroked = false
    color = vec(0.7, 0.78, 0.88, 0.7)
}

fun edgeSet(neighbors: List<VecNeighbor2>, c: Vec4, t: Double): FLine = fline {
    neighbors.forEach { n ->
        moveTo(q.x, q.y)
        lineTo(n.point.x, n.point.y)
    }
    color = c
    thickness = t
}

val queryDot = fline {
    moveTo(q.x, q.y)
    pointed = true
    pointSize = 10.0
    stroked = false
    color = vec(1.0, 0.9, 0.35, 1.0)
}

lines(
    [
        cloud,
        edgeSet(kApprox, vec(0.55, 1.0, 0.66, 0.35), 1.2),
        edgeSet(kExact, vec(0.56, 0.86, 1.0, 0.95), 2.2),
        edgeSet(radius, vec(1.0, 0.62, 0.36, 0.45), 1.5),
        queryDot,
    ],
    channel = "neighbors-query",
    w = 1120.0,
    h = 720.0,
    fitToSize = true,
)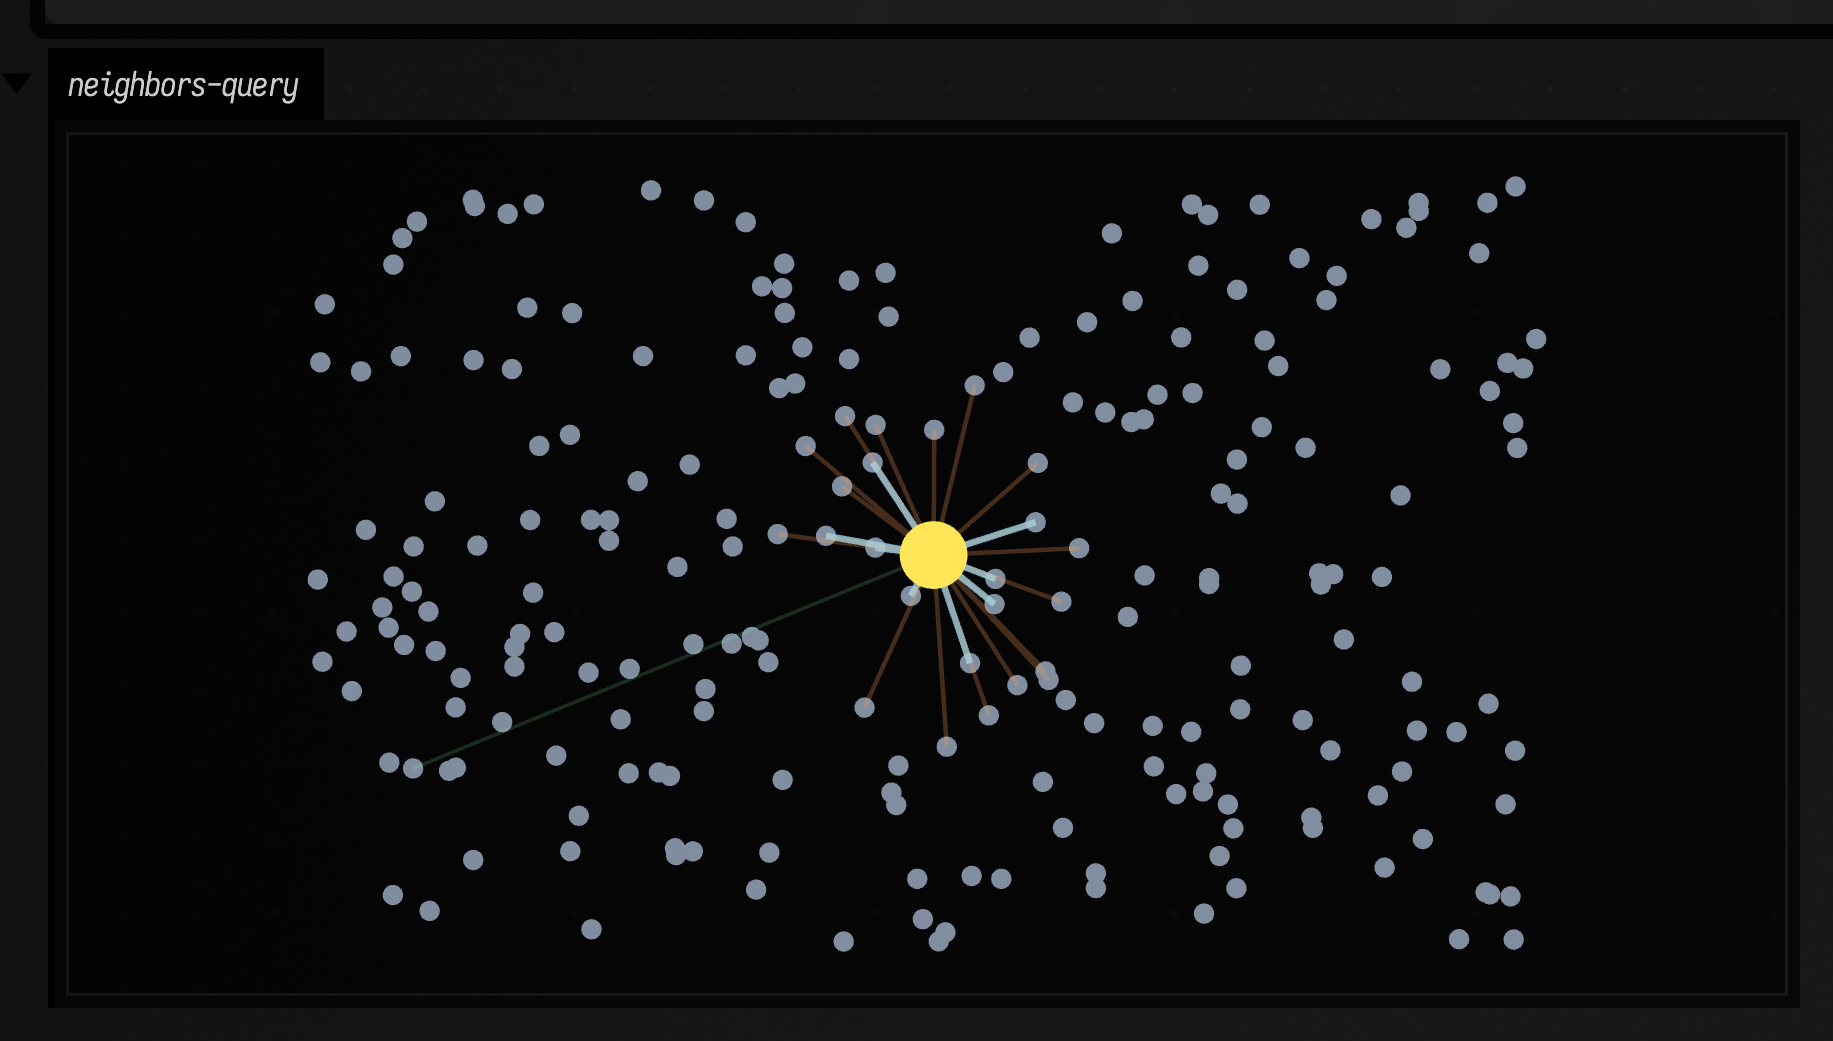
The exact search is the correct answer, and the approximate search trades some
accuracy for speed. Where an approximate edge lands on a point the exact search
did not choose, that is the accuracy you gave up. The radius query returns
however many points are close, so in a sparse part of the cloud it can return
fewer than k points, or none.
Tuning the approximate index
The approximate search is built on locality-sensitive hashing (LSH), and its build options decide which neighbours it finds. Bucket width, projection count and hash size all change the answer. The example below changes only those options, and keeps the query, the point cloud and the drawing as they were.
:::before
val points = List(260) { vec(50.0 + random() * 1000.0, 50.0 + random() * 600.0) }
val q = vec(550.0, 330.0)
val index = vec2NN(points, mode = VecNNMode.APPROXIMATE)
val nn = index.kNearest(q, 14)

val edges = fline {
    nn.forEach { n ->
        moveTo(q.x, q.y)
        lineTo(n.point.x, n.point.y)
    }
    color = vec(0.62, 0.9, 1.0, 0.95)
    thickness = 2.0
}
val dots = fline {
    points.forEach { p -> moveTo(p.x, p.y) }
    pointed = true
    pointSize = 2.4
    stroked = false
    color = vec(1, 1, 1, 0.65)
}
lines([dots, edges], channel = "neighbors-lsh", w = 1120.0, h = 720.0, fitToSize = true)
:::after
val points = List(260) { vec(50.0 + random() * 1000.0, 50.0 + random() * 600.0) }
val q = vec(550.0, 330.0)
val index = vec2NN(
    points,
    mode = VecNNMode.APPROXIMATE,
    options = VecNNBuildOptions(lshBucketWidth = 0.75, lshProjectionCount = 14, lshUniversalHashSize = 20011),
)
val nn = index.kNearest(q, 14)

val edges = fline {
    nn.forEach { n ->
        moveTo(q.x, q.y)
        lineTo(n.point.x, n.point.y)
    }
    color = vec(0.56, 1.0, 0.68, 0.95)
    thickness = 2.4
}
val dots = fline {
    points.forEach { p -> moveTo(p.x, p.y) }
    pointed = true
    pointSize = 2.4
    stroked = false
    color = vec(1, 1, 1, 0.65)
}
lines([dots, edges], channel = "neighbors-lsh", w = 1120.0, h = 720.0, fitToSize = true)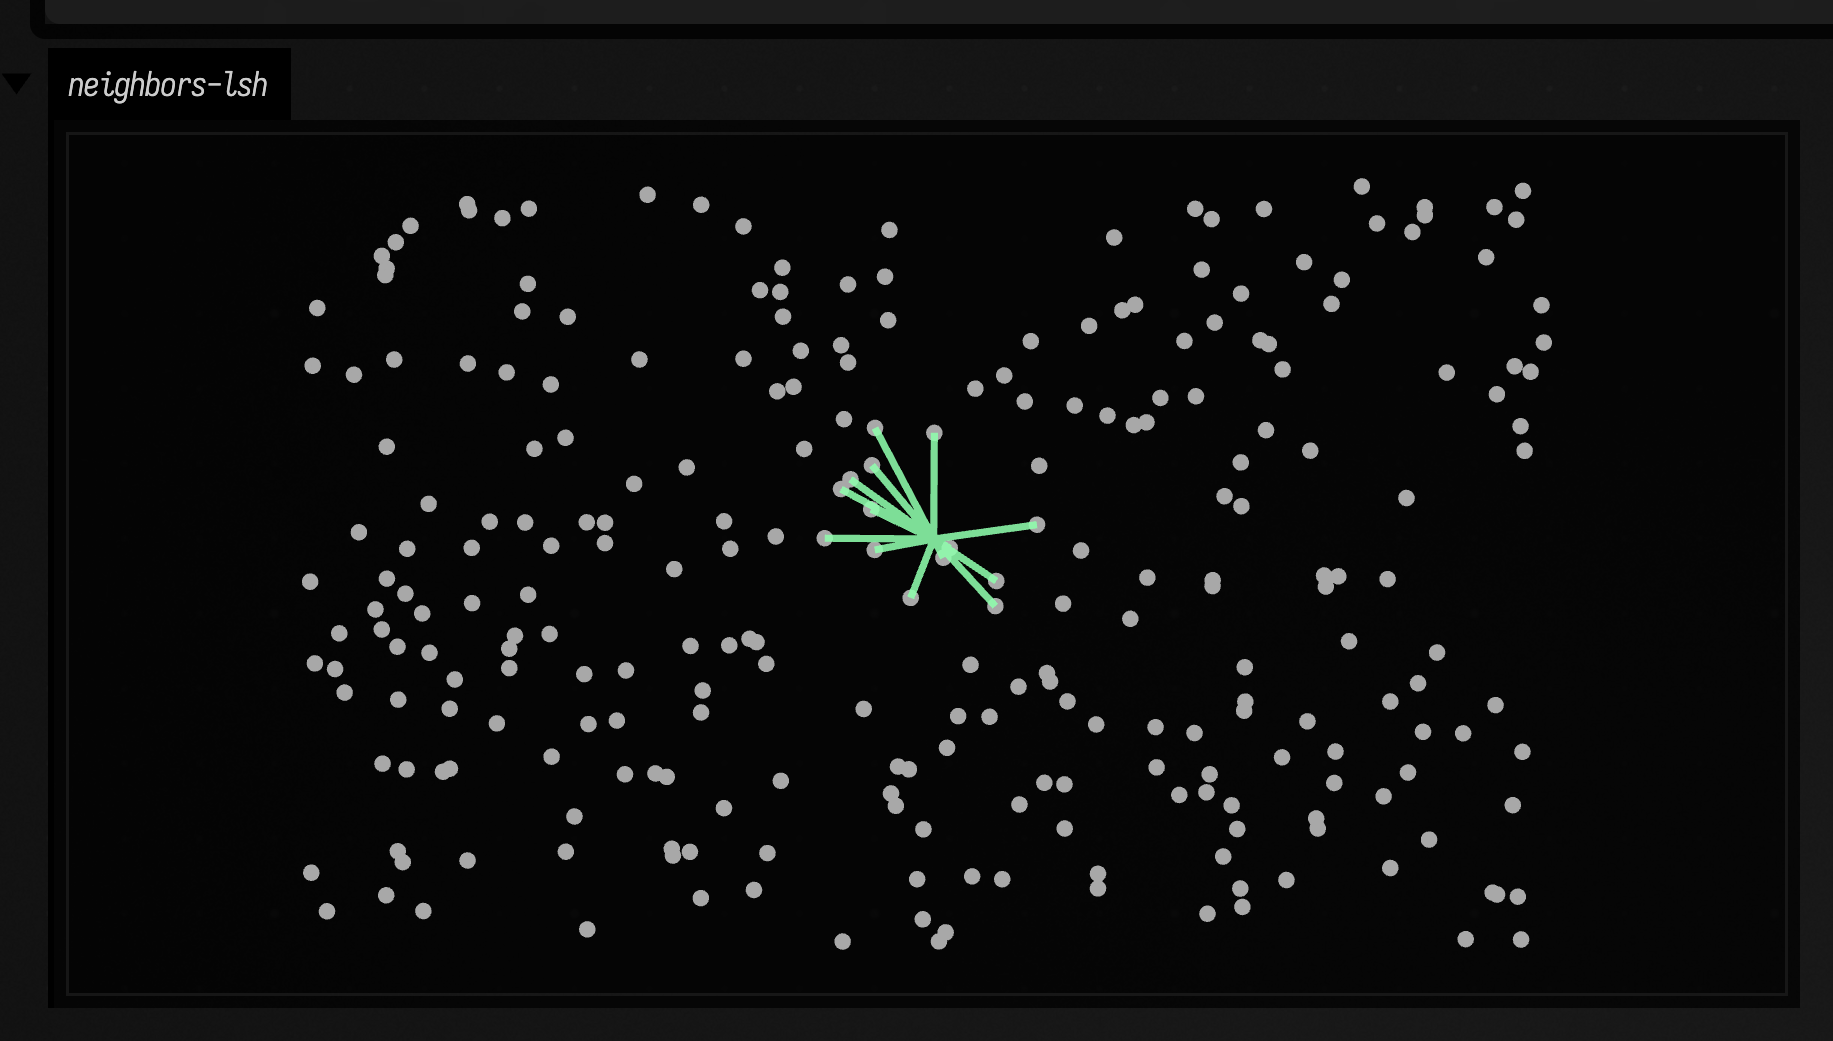
Anything you build on the neighbours (clustering, paths, interaction) sees only what the index returns, so if a neighbourhood looks unstable, tune the index first.
Geometric graph families on one point cloud
One point cloud supports several reasonable graphs, and four of the five below nest inside one another. The minimum spanning tree is a subset of the relative-neighborhood graph, which is a subset of the Gabriel graph, which is a subset of the Delaunay triangulation. Urquhart sits off to the side of that chain: it is the Delaunay triangulation with the longest edge of each triangle removed. The example draws all five over the same cloud.
:::static
val points =
    List(140) { i ->
        val a = i / 140.0 * PI * 2.0
        val r = 180.0 + 95.0 * sin(a * 3.0)
        vec(560.0 + cos(a) * r + (-24.0 + random() * 48.0), 360.0 + sin(a) * r * 0.65 + (-18.0 + random() * 36.0))
    }

val delaunay = vec2DelaunayGraph(points)
val gabriel = vec2GabrielGraph(points)
val urquhart = vec2UrquhartGraph(points)
val rng = vec2RelativeNeighborhoodGraph(points)
val mst = vec2MinimumSpanningTree(points)

fun graphLine(graph: PointGraph, color: Vec4, thickness: Double): FLine = fline {
    graph.edges.forEach { e ->
        val a = points[e.i]
        val b = points[e.j]
        moveTo(a.x, a.y)
        lineTo(b.x, b.y)
    }
    this.color = color
    this.thickness = thickness
}

val cloud = fline {
    points.forEach { p -> moveTo(p.x, p.y) }
    pointed = true
    pointSize = 3.2
    stroked = false
    color = vec(1.0, 1.0, 1.0, 0.72)
}

lines(
    [
        graphLine(delaunay, vec(0.52, 0.62, 0.75, 0.25), 1.0),
        graphLine(gabriel, vec(0.56, 0.92, 1.0, 0.45), 1.3),
        graphLine(urquhart, vec(0.92, 0.55, 1.0, 0.5), 1.45),
        graphLine(rng, vec(1.0, 0.7, 0.32, 0.55), 1.6),
        graphLine(mst, vec(0.56, 1.0, 0.67, 0.95), 2.6),
        cloud,
    ],
    channel = "graph-families",
    w = 1180.0,
    h = 760.0,
    fitToSize = true,
)
The scene stays fixed while the graph family changes. One graphLine(...)
helper defined in the fence draws all five, taking the colour and thickness for
each as arguments.
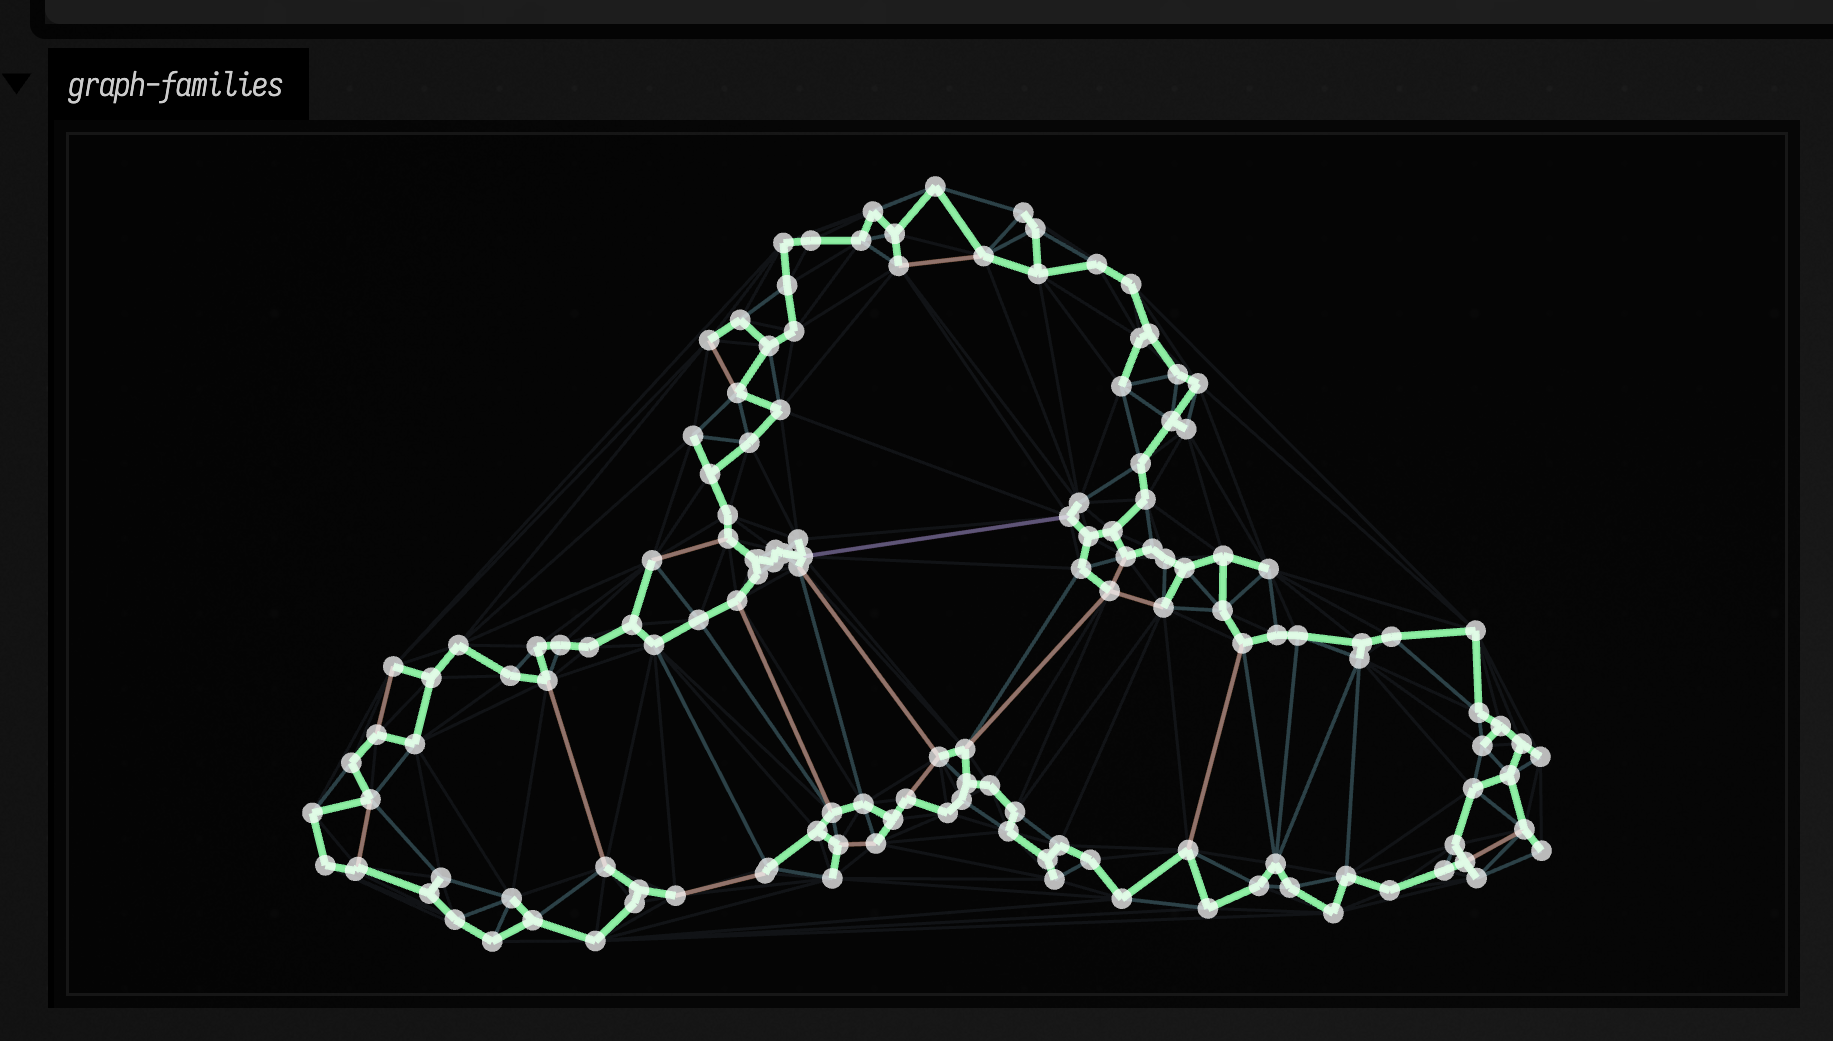
Delaunay is drawn thinnest and faintest, and each sparser family is drawn thicker and more opaque, up to the spanning tree. The sparser a family is, the more it stands out, and the edges every family agrees on are drawn five times over.
Orthant neighborhoods: one edge per direction
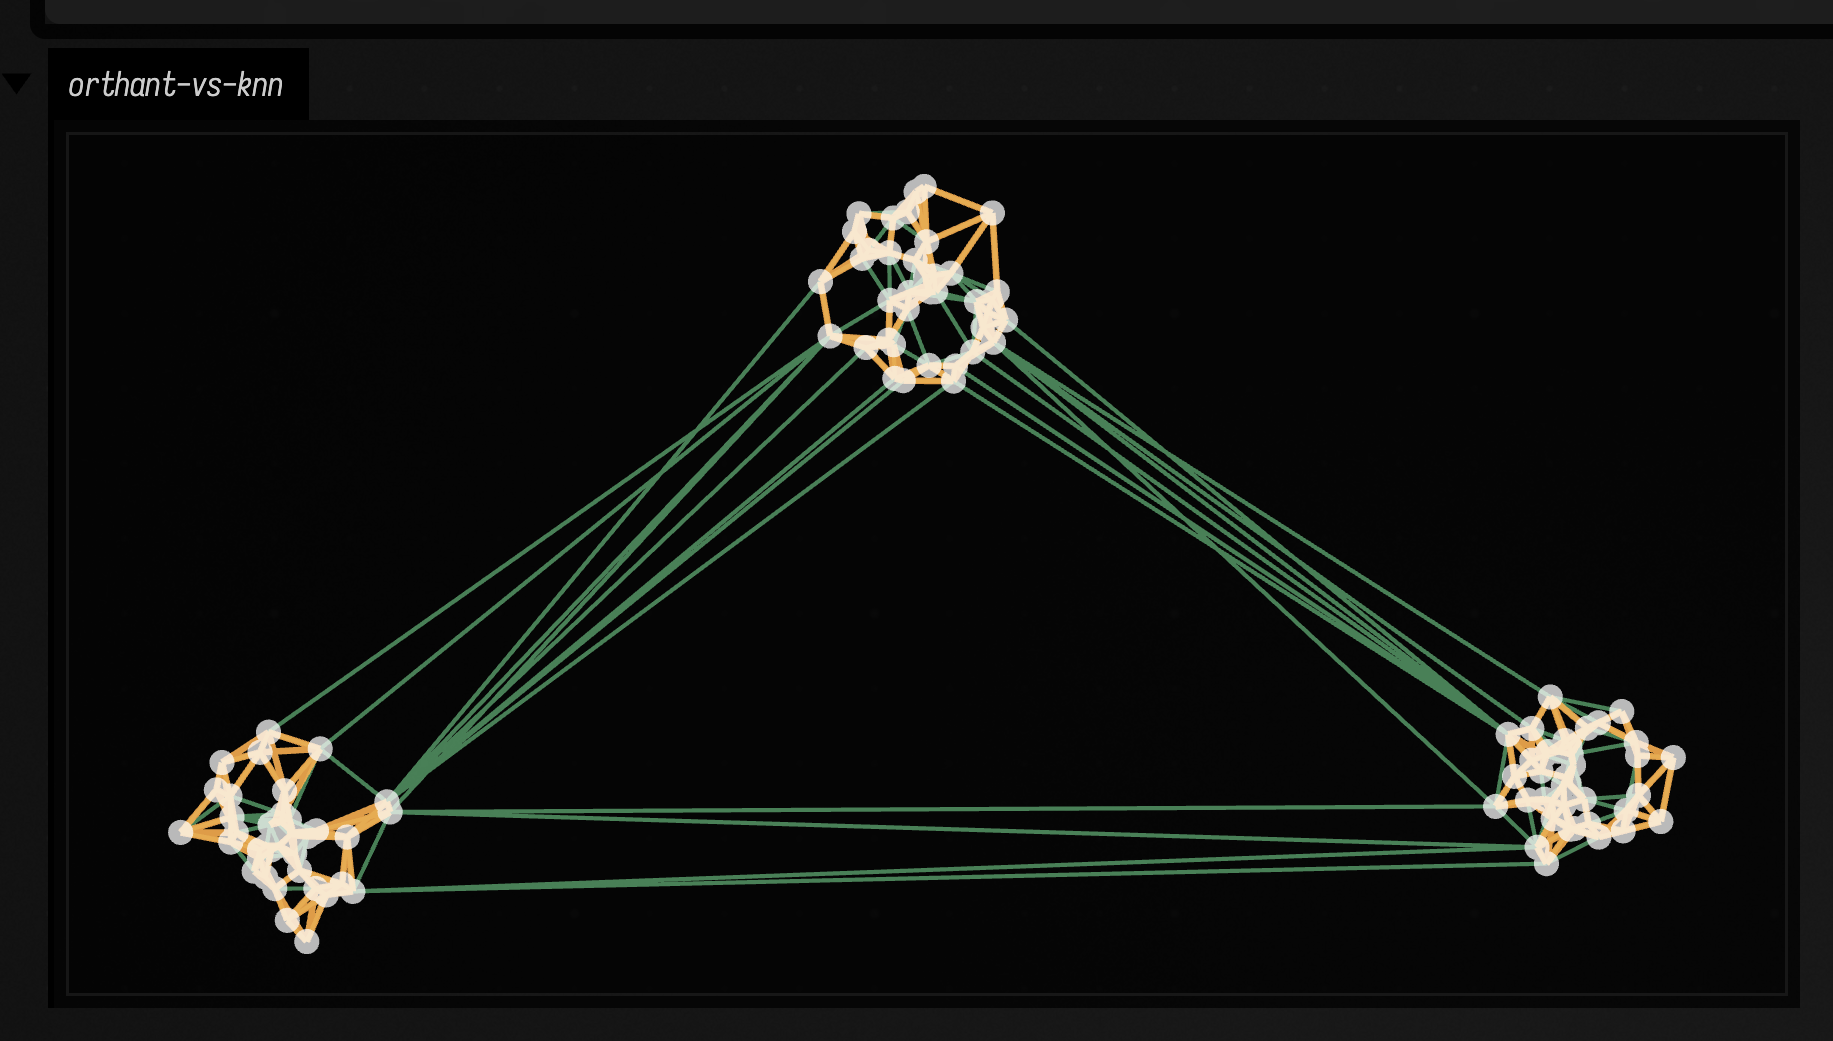
A k-nearest-neighbor graph asks only how close. On this clustered cloud, every
edge stays inside its cluster and the graph falls apart into islands.
vec2OrthantGraph(...) also asks which way. It splits the plane around each
point into four quadrants along the coordinate axes and joins the point to its
nearest neighbor in each quadrant that has one. That gives each point at most
four edges of its own, and the points other points choose add more. A point on
the edge of a cluster facing another cluster has an empty quadrant on its own
side, so its nearest neighbor in that direction is across the gap. The example
draws both graphs over three clusters.
When no two points share an x or a y coordinate, the orthant graph is always connected: it is the four-cone Yao graph, which is known to be a spanner. The quadrants are open, though, so a point lying exactly on another point's axis is in none of its quadrants. Points on a grid, or a row with equal y values, can come out with missing edges or no edges at all; jitter them slightly first.
:::static
val centers = [vec(250.0, 550.0), vec(600.0, 250.0), vec(950.0, 520.0)]
val points = centers.flatMap { c ->
    List(40) {
        val a = random() * PI * 2.0
        val r = random() * 60.0
        vec(c.x + cos(a) * r, c.y + sin(a) * r)
    }
}

val knn = vec2KnnGraph(points, k = 4)
val orthant = vec2OrthantGraph(points)

fun graphLine(graph: PointGraph, color: Vec4, thickness: Double): FLine = fline {
    graph.edges.forEach { e ->
        val a = points[e.i]
        val b = points[e.j]
        moveTo(a.x, a.y)
        lineTo(b.x, b.y)
    }
    this.color = color
    this.thickness = thickness
}

val cloud = fline {
    points.forEach { p -> moveTo(p.x, p.y) }
    pointed = true
    pointSize = 3.2
    stroked = false
    color = vec(1.0, 1.0, 1.0, 0.72)
}

lines(
    [
        graphLine(orthant, vec(0.56, 1.0, 0.67, 0.8), 1.4),
        graphLine(knn, vec(1.0, 0.7, 0.32, 0.9), 2.2),
        cloud,
    ],
    channel = "orthant-vs-knn",
    w = 1180.0,
    h = 760.0,
    fitToSize = true,
)
The orange 4-NN edges are drawn on top and never leave their cluster. The green orthant edges are the ones that also run between clusters.
The quadrants follow the coordinate axes, not the data, so rotating the cloud
changes the graph. vec3OrthantGraph(...) does the same with the eight octants
in 3D. The ranking inside each quadrant uses
GraphConnectivityOptions.customDistanceMetric if you pass one, and Euclidean
distance otherwise.
3D graph families with threeLines(...)
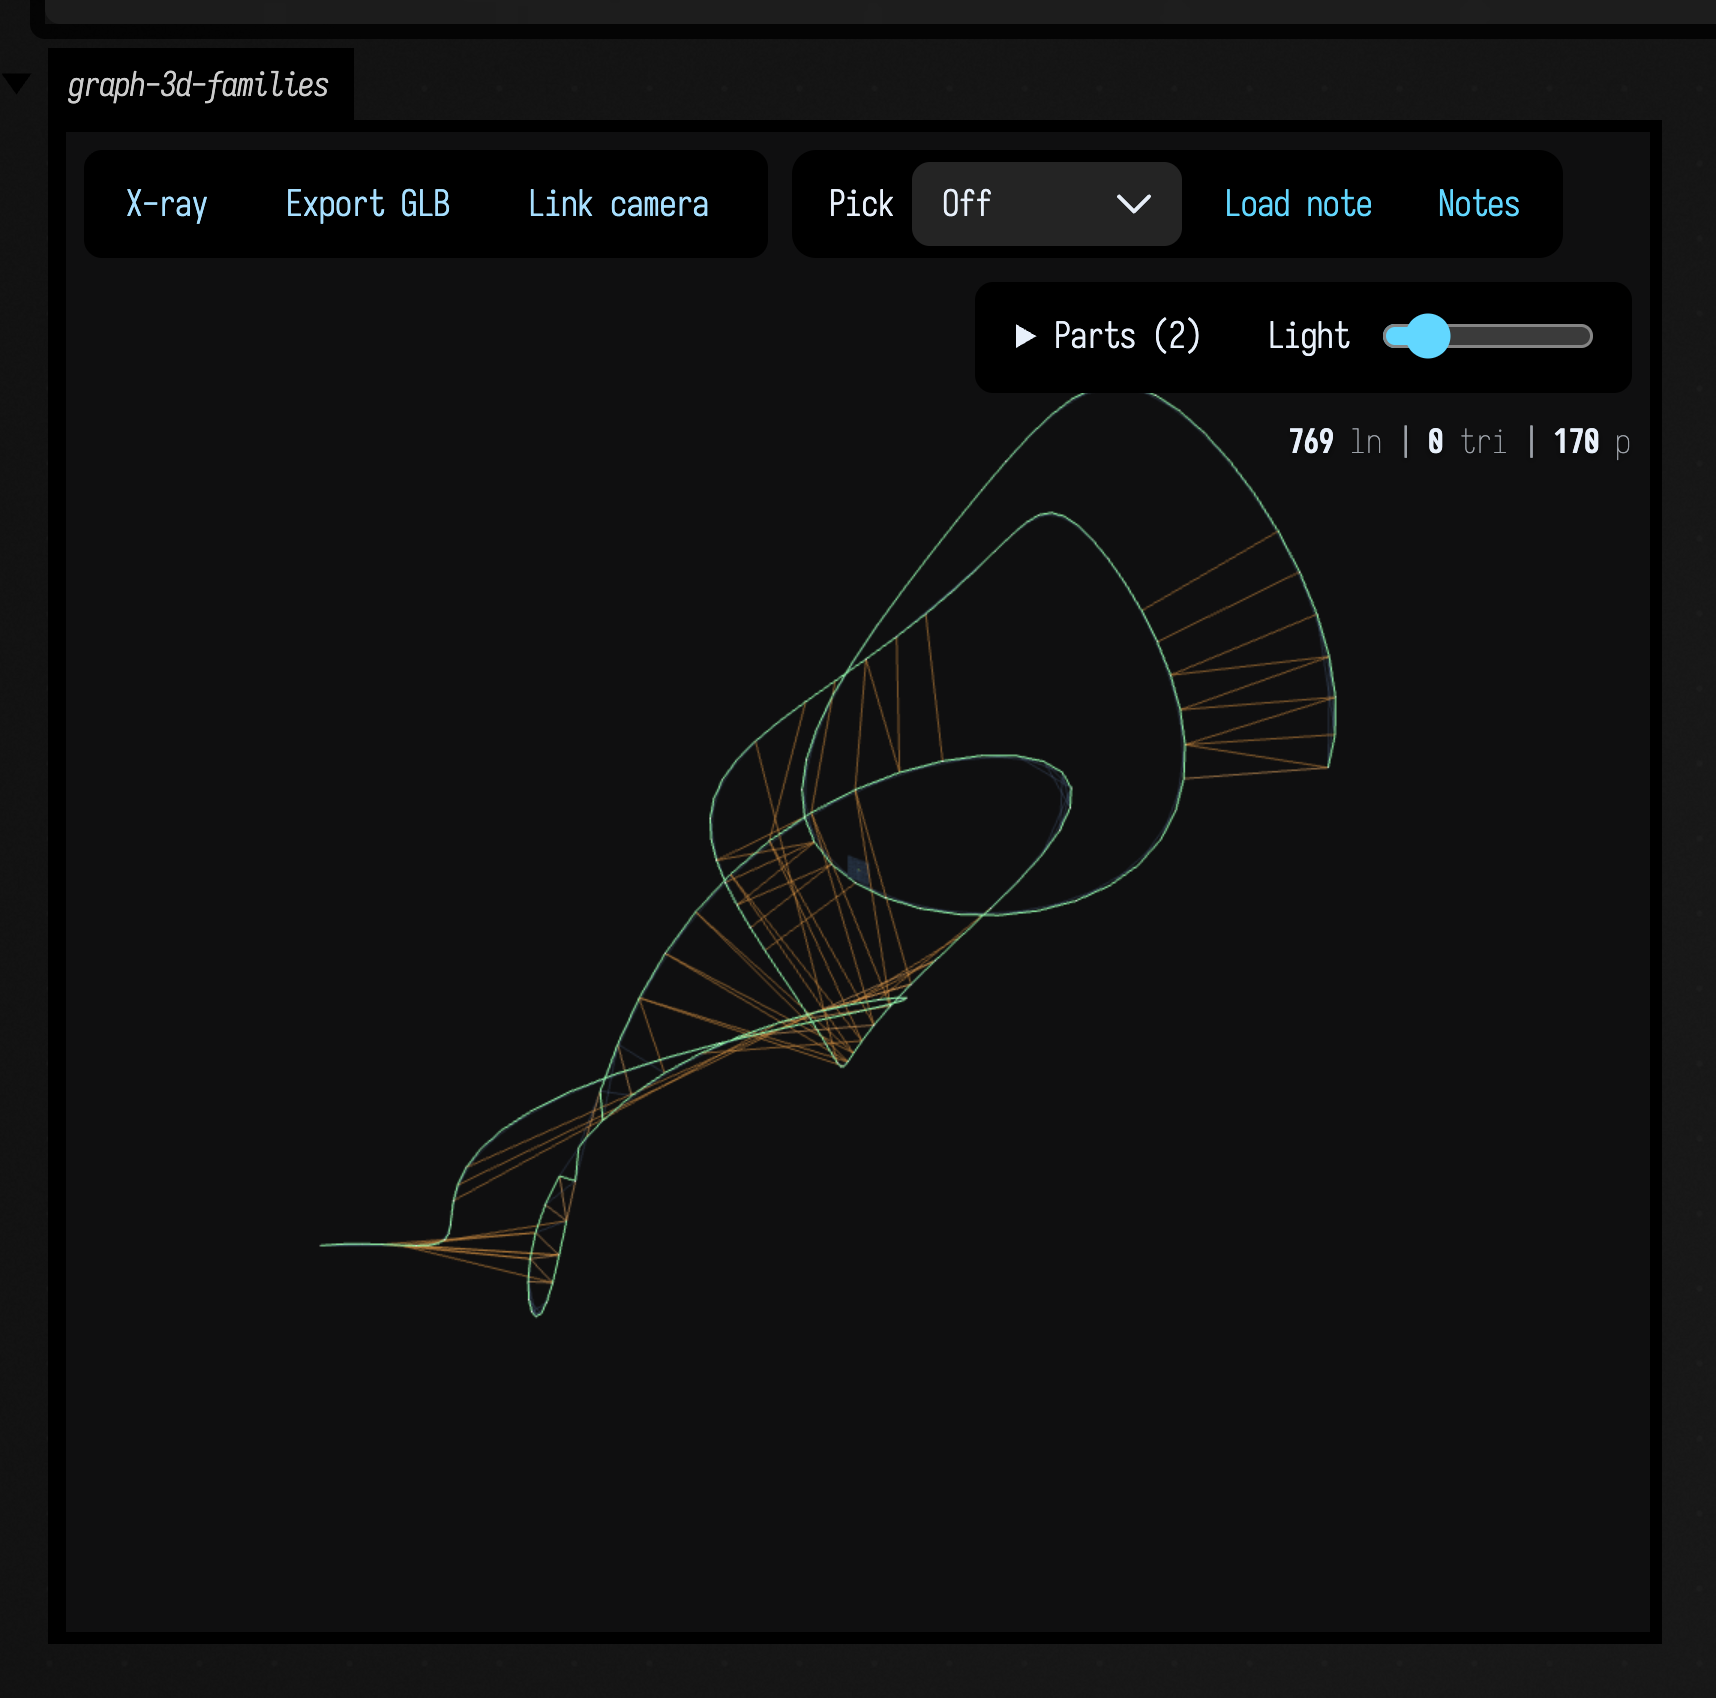
A flat projection stops working once points coil, stack or sit behind one another, because a crossing on the page and an edge in space look the same. The Three.js viewer takes the graph directly, so you can orbit around it. The example draws three graph families over a coiled 3D cloud.
:::static
val points =
    List(170) { i ->
        val t = i / 170.0 * PI * 7.0
        val radius = 95.0 + 34.0 * sin(t * 0.72)
        val x = cos(t) * radius + cos(t * 2.4) * 22.0
        val y = sin(t * 1.08) * 118.0 + sin(t * 0.31) * 28.0
        val z = -230.0 + i * 2.8 + cos(t * 1.6) * 44.0
        vec(x, y, z)
    }

val knn = vec3KnnGraph(points, k = 4)
val gabriel = vec3GabrielGraph(points)
val mst = vec3MinimumSpanningTree(points)

fun graphLine3(graph: PointGraph, color: Vec4, thickness: Double): FLine = fline {
    graph.edges.forEach { e ->
        val a = points[e.i]
        val b = points[e.j]
        moveTo(a)
        lineTo(b)
    }
    this.color = color
    this.thickness = thickness
}

val cloud = fline {
    points.forEach { moveTo(it) }
    pointed = true
    pointSize = 0.2
    stroked = false
    color = vec(1.0, 1.0, 1.0, 0.78)
}

threeLines(
    [
        graphLine3(knn, vec(0.52, 0.7, 0.95, 0.18), 1.0),
        graphLine3(gabriel, vec(0.96, 0.64, 0.28, 0.5), 1.6),
        graphLine3(mst, vec(0.58, 1.0, 0.68, 0.96), 3.1),
        cloud,
    ],
    channel = "graph-3d-families",
    height = 500,
    editable = false,
)
The faint 4-NN graph shows every local neighbourhood, Gabriel shows a cleaner structure in between, and the spanning tree leaves only the backbone.
Paths: covering a graph and finding a route
A graph becomes more useful once you ask it to do something. This example builds a k-nearest-neighbor graph and asks it for two answers: a cover that spreads outward from one anchor, and an A* path to a chosen goal. The base graph stays faded in the background.
:::static
val points = List(110) { vec(80.0 + random() * 940.0, 80.0 + random() * 560.0) }
val base = vec2KnnGraph(points, k = 4)

val anchor = 0
val cover = graphAnchoredGreedyThenDiameterCover(base, anchor)
val goal = points.indices.last
val path = vec2AStarPath(base, points, start = anchor, goal = goal)

fun edgeLine(graph: PointGraph, c: Vec4, t: Double): FLine = fline {
    graph.edges.forEach { e ->
        moveTo(points[e.i].x, points[e.i].y)
        lineTo(points[e.j].x, points[e.j].y)
    }
    color = c
    thickness = t
}

val baseLine = edgeLine(base, vec(0.62, 0.7, 0.8, 0.25), 1.0)

val coverLines =
    cover.paths.mapIndexed { i, p ->
        val hue = (i % 12) / 12.0
        val c = okhsv(hue, 0.82, 0.96, 0.92)
        fline {
            p.edges.forEach { e ->
                moveTo(points[e.i].x, points[e.i].y)
                lineTo(points[e.j].x, points[e.j].y)
            }
            color = c
            thickness = 2.3
        }
    }

val aStar = path?.let { p ->
    fline {
        breakNext()
        p.nodes.forEach { node ->
            val pt = points[node]
            lineTo(pt.x, pt.y)
        }
        color = vec(1.0, 0.96, 0.36, 1.0)
        thickness = 4.2
    }
}

val dots = fline {
    points.forEach { p -> moveTo(p.x, p.y) }
    pointed = true
    pointSize = 3.0
    stroked = false
    color = vec(1, 1, 1, 0.75)
}

val out = mutableListOf<FLine>()
out += baseLine
out += coverLines
if (aStar != null) out += aStar
out += dots

lines(out, channel = "graph-pathing", w = 1180.0, h = 760.0, fitToSize = true)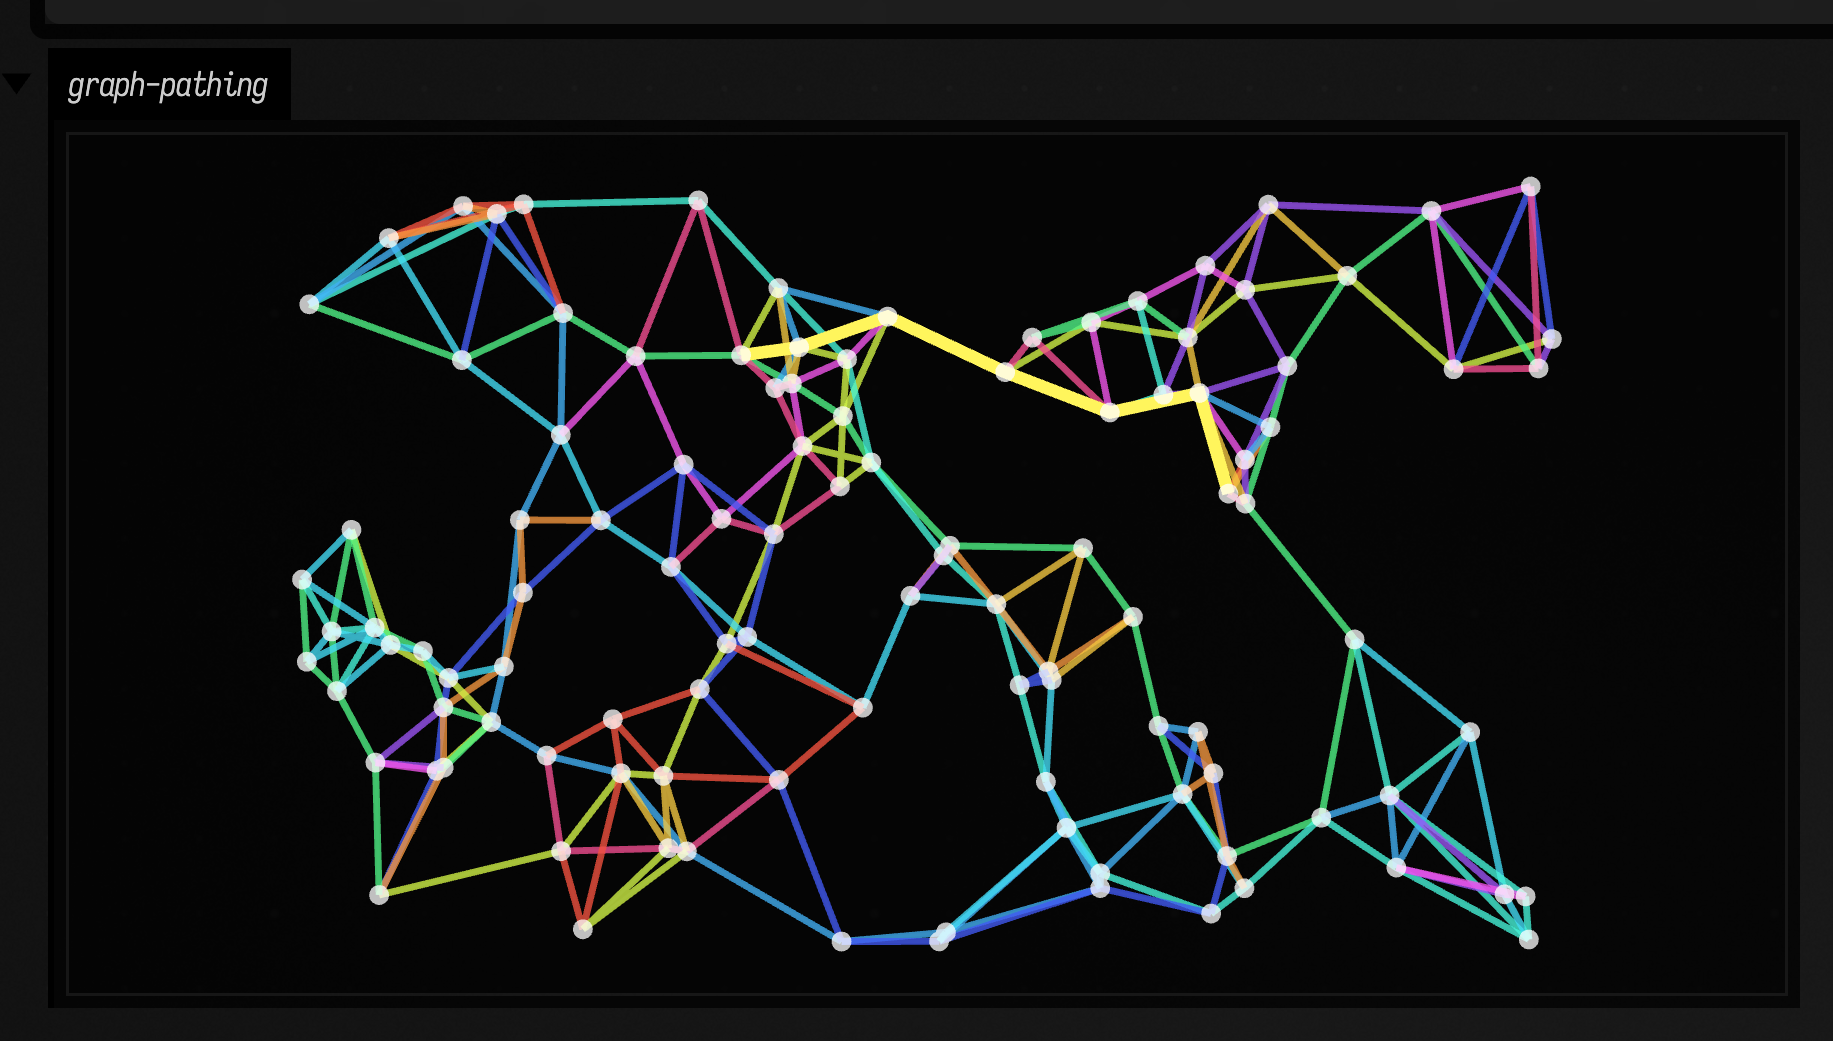
The two answers read differently off the same edges. graphAnchoredGreedyThenDiameterCover
covers edges, not points: it repeatedly walks from the anchor to the nearest
edge it has not used yet, and then hands whatever those walks could not reach to
a diameter decomposition instead. So the coloured paths together account for
every edge of the base graph, but not all of them start at the anchor — the
later ones are the leftovers, so a long path far from the anchor is not
necessarily something the anchor reached. The A* overlay is a
single route by cost, drawn on top of the cover.
Everything on this page assumes the points sit still. When the cloud moves every
frame and its edges have to be proposed, strengthened and forgotten as it goes,
see graphs that change while you watch. Its
snapshots turn back into the PointGraph used here, keeping only the edges that
have lasted.
The public declarations used on this page are listed, with their KDoc, in the codebase reference: graph_connectivity.kt, smile_neighbors.kt. Start from what's already in the box.