Profiling
When a piece starts to stutter, the Profiling Timeline can show you where its time and memory go. Record while your boxes run, then explore the capture to find expensive work.
We'll start with the timeline and a demo you can open. Later, Holding a frame budget helps you choose between Field's profiling tools, and Simulation time introduces a clock you advance yourself.
Run Show Profiling Timeline from the command palette while your boxes are running. Choose a capture length, then Record. Field records each box-owned coroutine resume scheduled through the Runloop or a box-owned simulation clock: its elapsed execution time, thread CPU time, and allocated heap bytes. Recording ends automatically, or you can press Latch. Your boxes keep running while you explore the capture.
Enable JVM stacks before recording to add sampled CPU and allocation stacks. After latching, Hot code groups the selected time interval by class, method, or line. This includes background workers and renderer CPU work, alongside the exact Runloop measurements in Coroutines & scopes. The panel resizes from its edges and corners.
Try the demo
The profiling_timeline starting point has four editable boxes. Find it on Field's welcome screen, or browse its code here. Launch boxes 1–3 together, then run 4. Record and explore. It opens the timeline and starts a three-second capture with JVM stacks enabled. Stop the workload boxes when you have your recording. Turn stacks off in the panel for counter-only comparisons.
For a complete replay, copy dev_docs/agents/transcripts/profiling_timeline.yaml into
your workspace's macros directory. Open an empty document, open Macro Recorder
from the command palette, select Workspace, and run profiling_timeline with
no boxes selected. The macro creates its boxes, waits for launch startup, warms the
workloads, records, and stops them. It leaves the timeline open for exploration.
Replay restores the demo's original code; use the boxes directly when keeping your edits.
To run the same macro from a script instead, see Driving Field from a script or agent.
| Box | What to look for | Try changing |
|---|---|---|
| 1. Steady work | Frequent small execution bars | Increase iterations to widen them |
| 2. Periodic bursts | Longer bars separated by quiet gaps | Increase iterations, or shorten quietMillis |
| 3. Allocate or reuse | Heap allocation despite relatively short execution | Set reuse = true and record again |
| 4. Record and explore | Starts the capture and opens the viewer | Change the capture duration |
The third box updates an array of Field vectors. With reuse = false, it constructs
a fresh array and fresh vec values on every iteration. With reuse = true, it calls
set on the existing vectors. Select that lane and switch to Allocated bytes to
compare them. Record each version under the same conditions; the exact time and byte
counts depend on the JVM and machine. Initialization happens before the recording,
so the comparison measures the running loops.
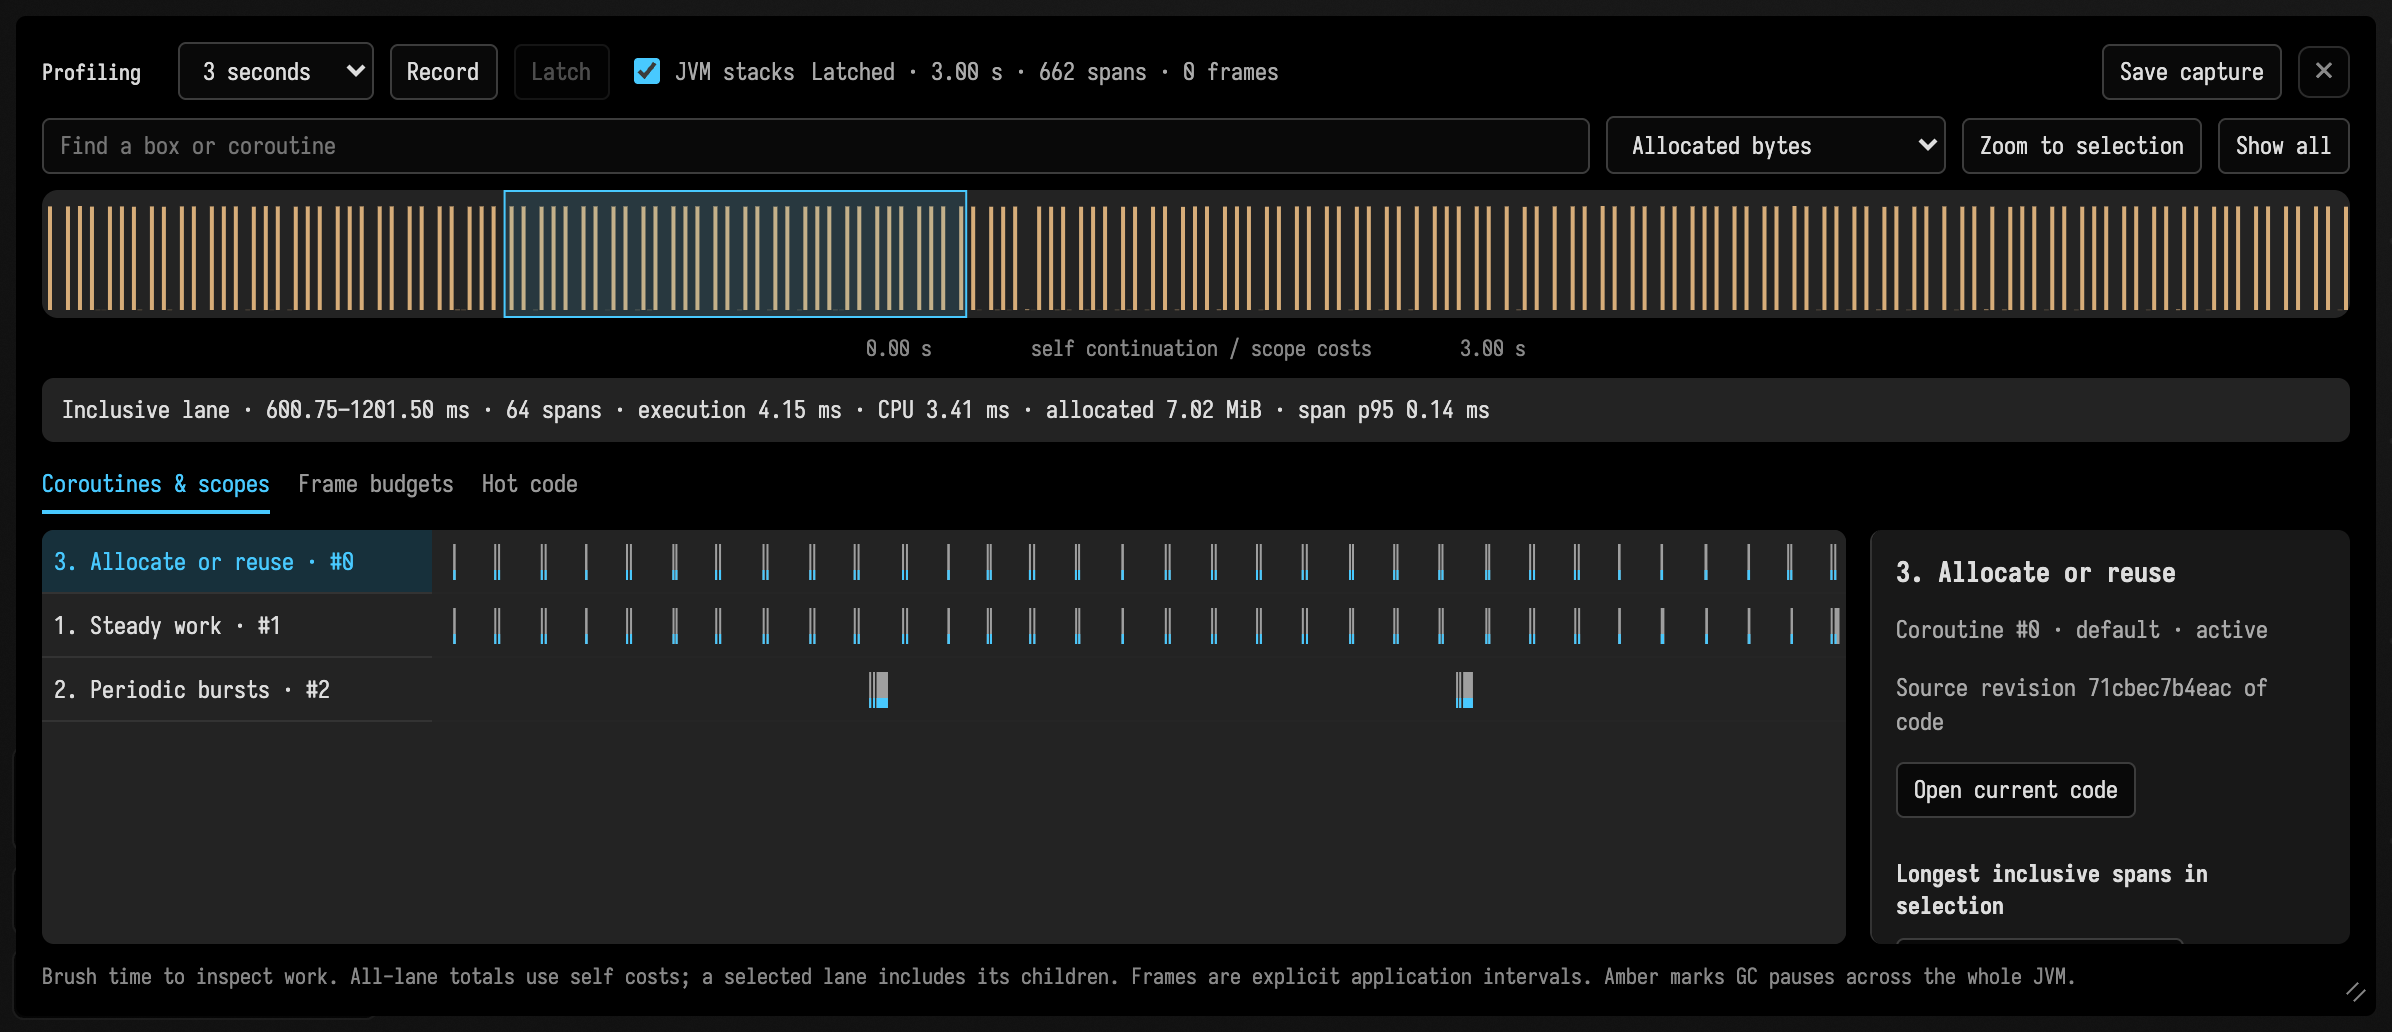
Complete frames and named scopes
The simulation_clock starting point adds explicit application frame boundaries and named children. Its first box launches and stops with Field's ordinary controls. The second starts a capture in this same panel.
Inside your running frames body, create the instrument once, then mark each iteration:
:::static
frames {
    val budget = frameProfile("Game", targetFps = 60.0, allocationKiB = 128.0)
    try {
        while (frame()) {
            budget.beginFrame()
            budget.measure("Update") { /* synchronous update */ }
            budget.measure("Sprites") { /* fill reusable buffers */ }
        }
    } finally {
        budget.close()
    }
}
This does not start another recorder. Use Record and Latch as before. When recording is off, these calls read no CPU or allocation counters and retain no samples. The first boundary establishes a baseline; subsequent boundaries complete intervals. Stopping a box discards its unfinished final interval.
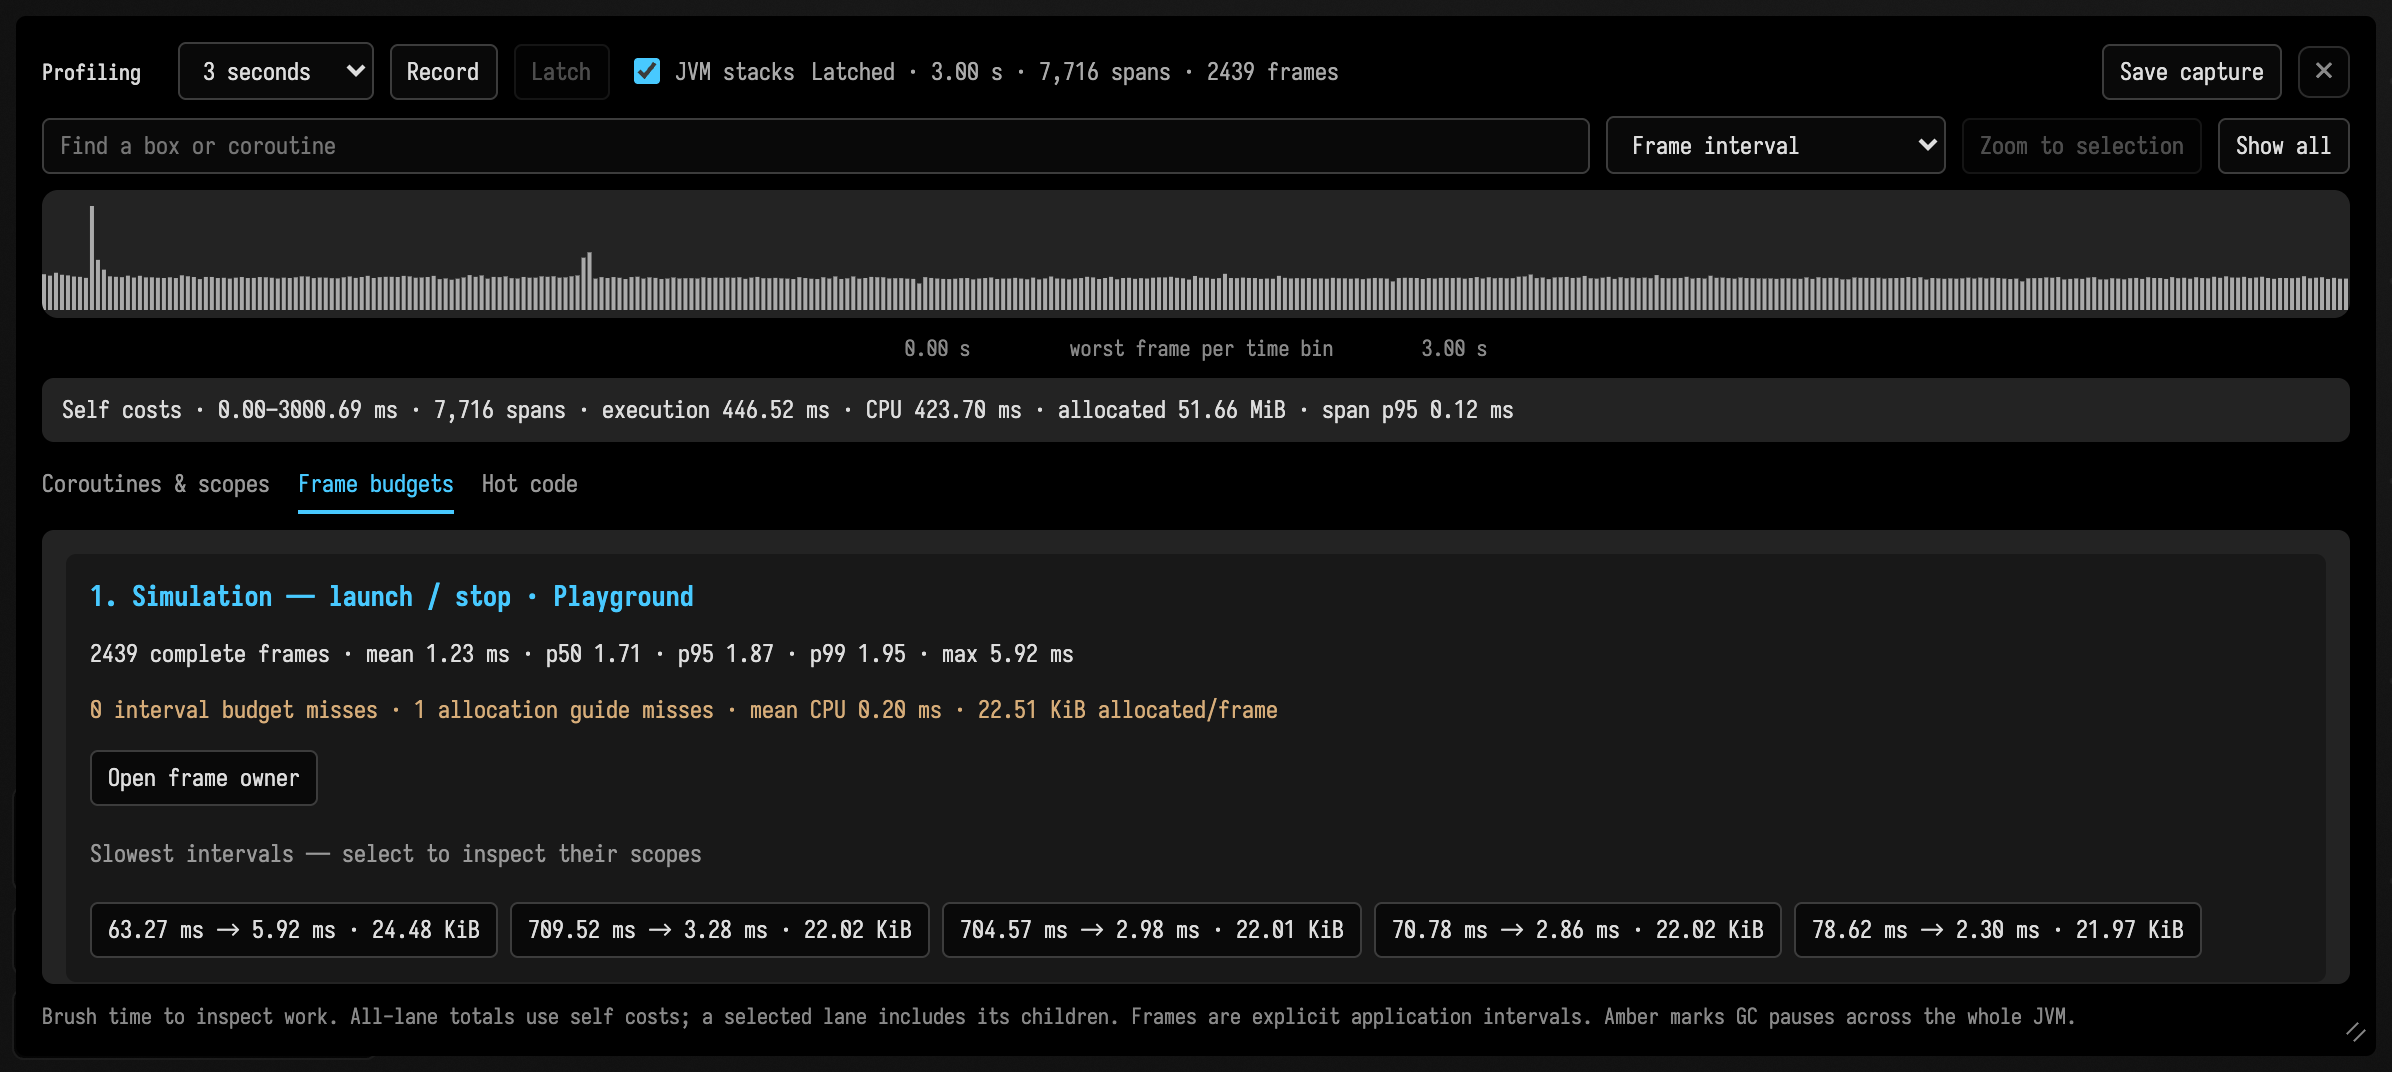
Choose Frame budgets to see mean, p50, p95, p99 and maximum interval, mean thread CPU,
allocated bytes per frame, and counts exceeding your interval or allocation guide. Select
one of the slowest intervals, then switch to Coroutines & scopes or Hot code: the
brush stays on that interval. Frame interval and Bytes per frame also work as
overview metrics; each time bin shows its largest frame value so a rare hitch stays
visible. A frame interval includes suspension, waits, and other work between its
boundaries; CPU and heap counters cover its thread, including other boxes on that thread.
These are application intervals, not GPU presentation measurements. If your update loop
already skips repeated renderer frames, place beginFrame() after that guard so each
record corresponds to one actual update.
measure and profileScope("name") { … } label synchronous work: a suspension inside one does
not compile, and a scope that ends on another thread is marked "moved threads". Standard launch(CoroutineName("Orbit")) { … } labels child
lanes, including children dispatched by SimulationClock. A selected lane reports
inclusive costs. All-lane totals and the overview use self costs, subtracting measured
children so nested scopes are counted once. Parent bars still enclose child work.
Collector counts and collection time cover the whole JVM during the recording. With JVM stacks enabled, amber ticks mark recorded GC pause events. Collector time and stop-the-world pause duration are different quantities; neither belongs exclusively to one box. Up to 8,192 frame intervals are retained separately from the span ring; overwritten frame history is reported in the frame tab. Saved capture JSON includes both streams.
Explore a capture
- Drag across the overview to select a time range. Left and right arrow keys move the selection; Escape clears it.
- Choose Execution time, CPU time, or Allocated bytes for the overview.
- Press Zoom to selection to spread that interval across the coroutine lanes.
- Select a lane to focus its totals, then click a span to inspect one resume. Each lane belongs to a coroutine, so one box can have several lanes.
- The detail panel lists the longest resumes in the selection. Click one to zoom around it, or use Open current box code to return to its owner in the editor.
- Show all resets the range and lane selection. The search field filters by box, strand, or coroutine number.
- Save capture downloads the completed capture as JSON. Closing and reopening the panel retains the latest capture; recording again replaces it.
The full width of a span is elapsed execution time. Its cyan lower strip shows the portion accounted for by thread CPU time. Empty space between spans means that coroutine was not executing on the Runloop: it might have yielded, suspended, or moved to another dispatcher. A coroutine marked active is not necessarily using CPU at that moment.
Selection totals include whole resumes whose start lies inside the selection. An allocation counter cannot tell us where within a resume the allocations happened, so brushing through part of a span does not divide its byte count. The displayed p95 is for individual resumes, not whole frames. Each inspected span also carries its Runloop tick number.
Classes, methods, and box lines
Turn on JVM stacks, record while the work is running, then open Hot code. Stack processing happens after the latch; the panel shows its progress. Brush the same overview to restrict the samples, and search for a package, class, or method. Choose Classes, Methods, or Lines, and switch between CPU samples and Allocation samples.
Whole JVM includes other documents, compilation, renderer workers, and background threads. Use the thread selector to isolate a worker. Selected coroutine keeps only samples whose thread and timestamp fall inside that coroutine's measured resumes. Worker-thread samples are not automatically attributed to the box that started them.
Including callees counts a sample in each distinct stack row it contains; these rows overlap and must not be added together. Top frame only attributes each sample to its innermost recorded frame. CPU percentages are shares of sampled events, not percentages of exact CPU milliseconds. Allocation weights estimate heap bytes; use the coroutine counters for exact bytes within a resume. The first allocation event per thread is omitted because its weight can include bytes from before recording. Short work may fall between samples, and JIT optimization can affect line attribution.
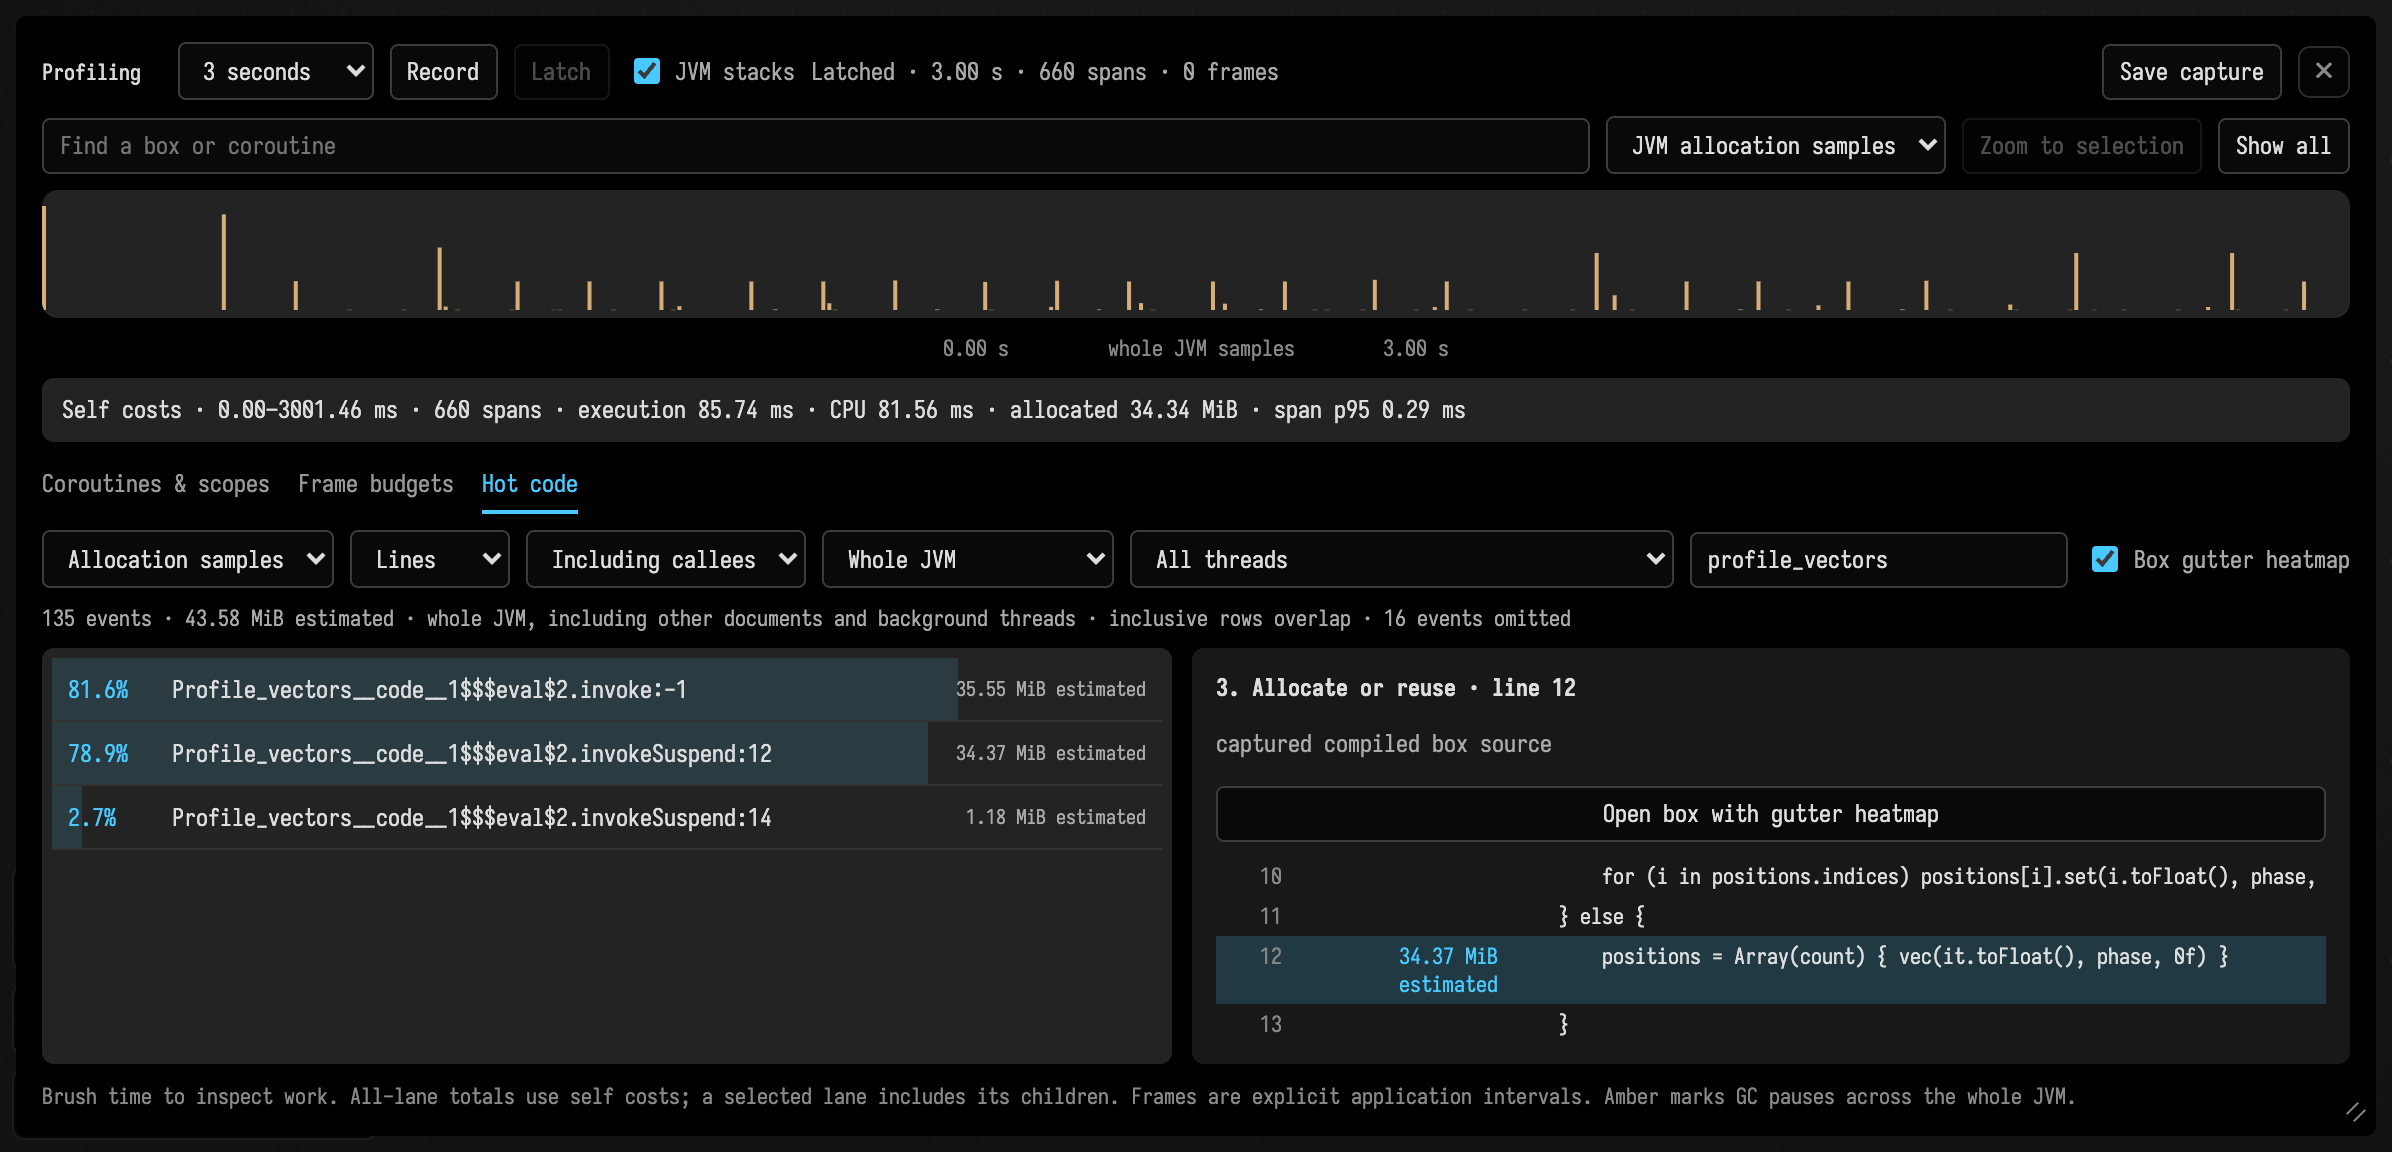
Select a hot row to read its source. Box source is copied from Field's compiled snippet records. Open box with gutter heatmap takes you to the box in the editor. With Box gutter heatmap enabled, sampled lines carry a gutter stripe: cyan for CPU, amber for estimated allocation, with brightness relative to the hottest mapped line in that box. Hover a marked line for its sample count or byte estimate and the selected interval. The heatmap follows the time brush, thread, coroutine scope, and self/inclusive setting, including when you navigate to another sampled box. The class/method search filters the table only. These stripes coexist with history churn and execution density.
Only directly mapped lines whose box, property, and current text match the capture are marked. Editing the source clears its marks; restoring the captured text restores them. Closing the profiling panel clears the heatmap. Fragments or generated lines without a verified mapping remain available as compiled source in the panel. Codebase source is read from the checkout after capture, when available; it may differ from the loaded class after a source edit. Missing source does not hide a hot class.
What the numbers mean
Allocated bytes measure heap allocation on the executing thread, including coroutine and library work inside that resume. They are not retained memory, bytes reclaimed by GC, or native/GPU memory. CPU and allocation counters exclude suspended time; unsupported JVM counters appear as unavailable. Elapsed execution time can include blocking and pauses during the resume, but this view does not identify their causes.
The timeline covers loop, frames, sequence launches, and child coroutines that
inherit a box's coroutine context and dispatch through the Runloop. Work executed
inline inside a parent's resume is included in that parent; a child's later scheduled
resumes have their own lane. Unowned Runloop tasks and work on other threads, including
background compilation and renderer execution, are outside the exact resume counters.
Optional JVM stacks cover their sampled CPU/allocation activity. GPU timings are in the
renderer profiler; this panel does not show them.
The source revision is a fingerprint of the property that was launched, taken at launch. The source button opens that property as it is now, and the detail says when it has been edited since the capture. Use Hot code for sampled source lines.
Capture limits
Capture lengths are 3, 10, or 30 seconds. An already executing resume is allowed to finish after the latch so a long stall is still included. Closing the panel does not cancel a capture; its deadline still applies. Only one document can record at a time.
The backend keeps at most 65,536 resumes and 1,024 coroutine lanes per capture, and the latest capture for up to four documents in memory. The panel reports omitted resumes when those limits are exceeded. A restart clears captures; save JSON if you want to keep one.
Optional JFR recording stops at the latch deadline, even if an already executing coroutine resume continues beyond it, and is limited to 64 MiB. The viewer keeps up to 12,000 stack events, 16,000 distinct frames, and 256 source texts (four million characters total), with at most 64 frames per stack. It reports omitted events. Stack/source processing runs off the Runloop. JFR startup can hitch before the measured interval; allow the scene to warm up and use identical sampling settings for comparisons. Saved captures include sampled source text and JVM-wide thread names.
Recording is opt-in. With no capture active, dispatch does not read timing or allocation counters or create sample objects. Recording adds counter reads and bounded bookkeeping; live viewing also requests and draws snapshots. For close performance comparisons, use the same capture settings and workload in each run.
GPU execution remains outside all of this, and so does the renderer's own always-on span timer — Holding a frame budget covers both, and says which of the three instruments answers which question.
For document versions and restoration, see Document History.
Profiling the flow_grain playground
The flow_grain starting point adds a fixed-size GPU workload and an explicit reset boundary. Its profile box resets contents, warms 60 rendered frames, then records a 180-frame pan/zoom path. Parameter snapshots distinguish requested values from effective limits. The timeline measures the frame thread and named input scopes; renderer GPU timers remain a separate measurement. Keep window size, parameters and stack-sampling settings identical when comparing captures.
Simulation time
A behaviour can wait, turn, fire, wait again, and cancel as ordinary Kotlin coroutine
code. SimulationClock lets those delays follow time you advance explicitly. It creates
no thread and no new kind of box launcher.
Open simulation_clock from the welcome screen's starting points, or browse the document. Select 1. Simulation — launch / stop and use Launch Box (Alt–Up) in the editor. Stop Box (Alt–Down) stops it and its two children; launching again starts fresh. Run 2. Record and explore to inspect the same work in the Profiling Timeline panel.
One owner, two clocks
The box below uses two clocks. The outer frames { } loop runs once per Field frame, on
wall-clock time. Inside it, withSimulationClock { } opens a simulation clock that owns two
child coroutines: Orbit, which turns a phase every step, and Pulse, which prints
every half second of simulation time. Each frame, the loop measures how much wall time has
passed and hands it to advance, which moves simulation time forward and runs whichever
children are due.
:::static
import kotlinx.coroutines.*

var phase = 0.0
frames {
    withSimulationClock {
        launch(CoroutineName("Orbit")) {
            try {
                while (isActive) {
                    phase += 0.04
                    sleep(stepSeconds)
                }
            } finally {
                println("Orbit stopped")
            }
        }
        launch(CoroutineName("Pulse")) {
            while (isActive) {
                println("pulse")
                delay(500) // simulation milliseconds
            }
        }
        runCurrent() // start children and establish their first waits
        var last = AnimationClock.nowSeconds()
        while (frame()) {
            val now = AnimationClock.nowSeconds()
            advance((now - last).coerceAtLeast(0.0))
            last = now
        }
    }
}
The outer frame() yields through Field's existing Runloop. Children run only when you
pump the simulation. delay and withTimeout inherit simulation time; sleep accepts
seconds. Change the elapsed time passed to advance for slow motion, pause by not
advancing, or pass a fixed duration for repeatable steps. time and tick describe the
simulation, not the wall clock. Choose another dispatcher explicitly only when you want
to leave that simulation and its timing semantics.
The default step is 1/60 second. Positive waits round up to ticks, and sleep(0.0) waits
one tick. Ready continuations run in queue order; timers due on the same tick preserve
registration order. advance(dt) { step -> … } runs the callback after each tick's ready
coroutines, which is a useful place for integration or collisions. Seed any random
choices yourself if repeatability matters.
When children need a shared sensor snapshot before they run, the overload
advance(dt, beforeStep = { index, count -> … }, onStep = { seconds -> … })
prepares each step before advancing its clock and resuming its children. The zero-based
index and total count let an application distribute observed input motion over catch-up
steps; integration still follows the children. Step callbacks cannot advance or close
the same clock recursively.
A clock accepts at most eight steps per advance and 1,024 resumes per tick by default.
SimulationAdvance reports performed steps, resumed and deferred continuations, and
elapsed seconds discarded by the catch-up limit. These bounds prevent an accumulating
catch-up queue; they cannot interrupt an infinite loop inside a coroutine. Keep individual
resumes short. runCurrent() pumps ready work without advancing time.
Stopping the box
withSimulationClock inherits the current box's job, source identity, and document.
It closes in finally: cancel the child tree, drain cancellation continuations, and
remove pending timers. Put resource cleanup in ordinary non-suspending finally blocks.
Cleanup cannot wait for future simulation time after the clock has stopped. A failing
child cancels the enclosing box through normal structured concurrency.
Use the scope inside frames, as above. A raw SimulationClock(context) is available
for backend code, but its caller must close it on the thread that advances it. Nothing
will advance a clock you hand back out of a box. Avoid GlobalScope for owned work.
Comparing two recordings
The starting point marks complete frame intervals and two scopes, Simulation and
Vectors. Its named Orbit and Pulse child lanes appear inside the update work.
Change reuse to false in the first box, relaunch, and record again to compare allocation
per frame. The measurements come from the existing recorder; see
Holding a frame budget for their scope and limits.
For a repeatable demonstration, run the workspace macro
dev_docs/agents/transcripts/simulation_clock.yaml in an empty document. It creates both
boxes, starts them, records, stops, and verifies child cleanup. The resulting capture
remains available after the work stops. Replay restores the example code; use the box
controls while keeping your own edits.
Holding a frame budget
Sixty frames a second is 16.67 milliseconds a frame, and a real-time piece either fits in that or it does not. When it stops fitting, Field can measure it three ways: renderer spans, coroutine resumes, and JVM samples. Each uses its own clock and counts different things, so their numbers will not agree; don't read one as if it were another.
The panel section above describes the controls. This section explains what the numbers mean and what each measurement misses, then walks from "it stutters" to a line of your own box code.
The three instruments
| Property | CPUSpan |
one coroutine resume | a JFR sample |
|---|---|---|---|
| what it measures | wall time of a named renderer span | wall time, thread CPU time and thread allocated bytes for one scheduled continuation | that a thread was here, or allocated here |
| clock | System.nanoTime() — wall only |
wall, plus ThreadMXBean CPU and allocation counters |
the JFR event clock, realigned to the capture |
| population | the last 500 samples per label, whole JVM | every Runloop or simulation-clock resume of every box in one document | every thread in the JVM, sampled |
| opt-in | no — always on | yes, 1–30 seconds | yes, with the capture |
| where you read it | the perf log line, the Inspector |
the Coroutines & scopes tab | the Hot code tab |
| exact or estimated | exact per sample, but the window forgets | exact | estimated |
CPUSpan tells you whether the renderer is keeping up. A resume tells you exactly what your
box's code cost on one turn. A sample tells you roughly where time is going across the whole
JVM. Pick the one that answers your question.
CPUSpan: renderer spans
CPUSpan (Renderer.kt:54) is the one you did not turn on. Every named
renderer span goes through Renderer.kt:80,
which brackets the block with nanoTime and pushes the difference into a per-label deque.
The renderer's own labels are acquire, record_cs, record_gfx, submit_cs, submit_gfx
and present, each suffixed with a window or context index; OpenXR and the virtual-texture
system add more of their own.
It is wall time, not CPU time. time reads System.nanoTime() and nothing else. A
present span that spends four milliseconds waiting on a fence reports four milliseconds,
and that is the right answer to did the frame land on time while being the wrong answer to
how much CPU did we burn. Nothing in CPUSpan reads a CPU counter.
Its window is 500 samples per label (Renderer.kt:55),
enforced by dropping the oldest on overflow
(Renderer.kt:61). For a label that fires
once a frame, 500 samples is the last eight and a third seconds at 60 Hz. Every
statistic it reports — avg, min, max, p1 through p99 — is a claim about that
window and about nothing before it.
This makes the percentiles easy to misread. They index a sorted copy of the window
(Renderer.kt:111),
so over a full window p99 is element 494 of 500 — the sixth worst sample. One bad
frame does not move it:
:::static
/*
Drive the real CPUSpan.time 600 times under a label of my own: 599 short spans and one
deliberate long one. Nothing here simulates the window — WINDOW and the percentile
function are the renderer's own.
*/
val label = "docs_window_probe"
repeat(599) { CPUSpan.time(label) { Thread.sleep(0, 200_000) } }
CPUSpan.time(label) { Thread.sleep(40) } // a sleep is a lower bound; the span reports what elapsed
val withHitch = CPUSpan.snapshot().first { it.label == label }

// 500 more spans is exactly one window. At 60Hz that is eight and a third seconds.
repeat(500) { CPUSpan.time(label) { Thread.sleep(0, 200_000) } }
val after = CPUSpan.snapshot().first { it.label == label }

val rows = ["just after the hitch (600 spans in)" to withHitch, "500 spans later" to after]
display(
    "main",
    Table(
            ["when", "n", "p50 ms", "p99 ms", "max ms"],
            title = "one deliberate hitch, seen through a 500-sample window",
            note =
                "across those 500 spans p99 moved by " +
                    (after.p99Ms - withHitch.p99Ms).f2 +
                    "ms while max fell by " +
                    (withHitch.maxMs - after.maxMs).f2 +
                    "ms. Over a full window p99 is the sixth " +
                    "worst sample and there was only one bad one, so it never saw the hitch at all; max is now " +
                    (if (after.maxMs > 10) "somehow still holding it" else "back among the short spans") +
                    ". A single stutter is visible in max, for eight seconds, and nowhere else.",
        )
        .rows(
            rows.map { (when_, s) ->
                [
                    when_,
                    s.n,
                    s.p50Ms.f2,
                    s.p99Ms.f2,
                    s.maxMs.f2,
                ]
            },
        )
        .role("when", CellRole.ACCENT)
        .roleBy("max ms") { if ((it as String).toDouble() > 10) CellRole.WARN else CellRole.OK }
        .expect("n", because = "the window is 500, so 600 and 1100 spans both report 500") { it == 500 },
)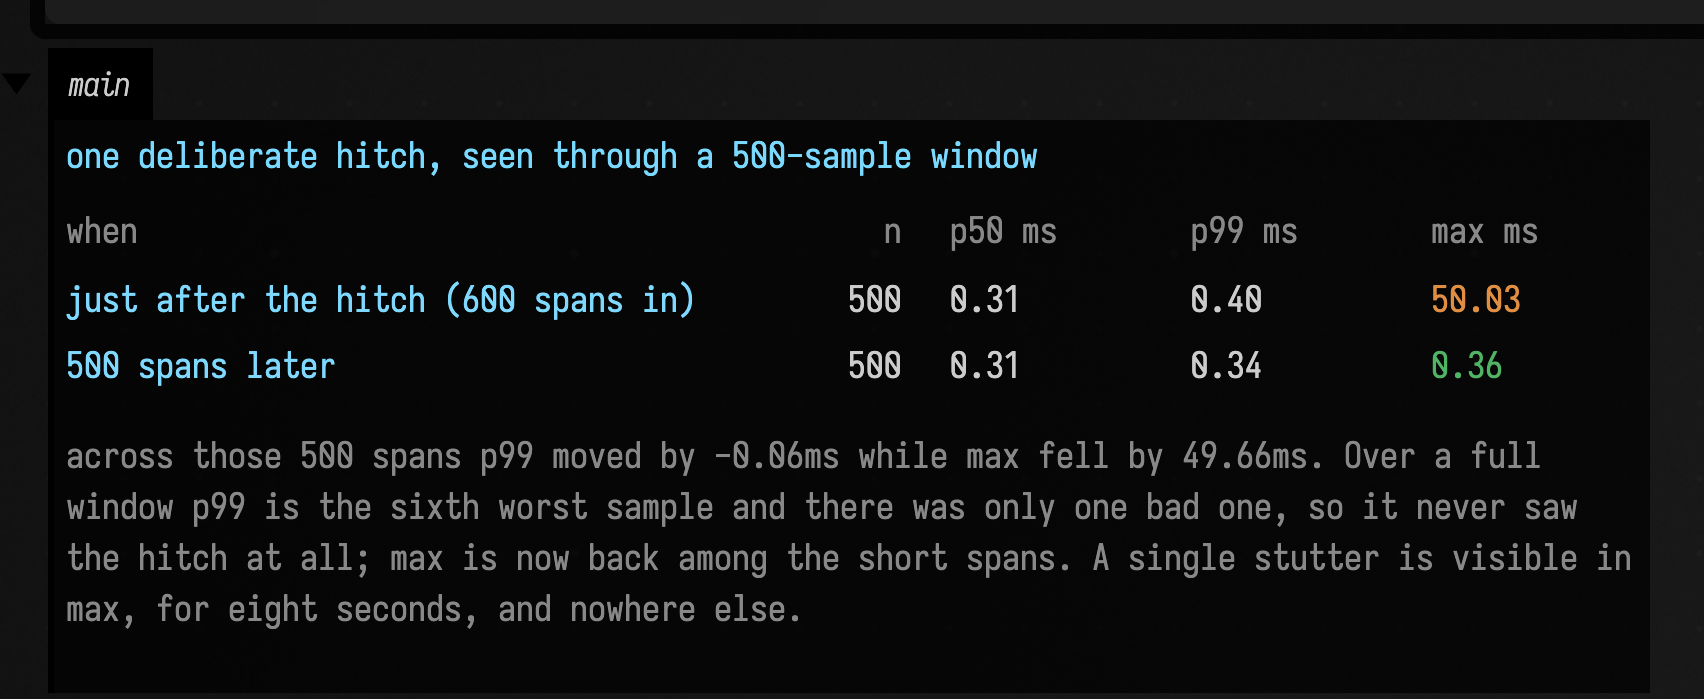
Six hundred spans in, n is 500 rather than 600 and the hitch is sitting in max — at
48.91 ms in the run above rather than the 40 asked for, because Thread.sleep is a lower
bound and the span reports the time that actually passed. Meanwhile p99 reads
0.33 ms, because one bad sample out of 500 cannot reach element 494. Five hundred spans
later max has fallen to 0.42 ms — and p99 is still 0.33, having moved by 0.00 ms
across the entire episode. A hitch that happens once a minute is invisible to every
CPUSpan percentile, and invisible to max for all but eight seconds of that minute. For
a stutter like that, use a coroutine capture instead of the perf line.
What else it cannot see: your box code, at all — the labels are renderer internals, so a
slow loop { } never appears here. GPU execution, at all — submit_gfx times the
submission, not the work. And when anything happened: the deque holds durations, not
timestamps, so it can tell you how bad the tail is and never when the tail happened.
The rolling snapshot reaches the terminal every five seconds
(Renderer.kt:51, driven from
Renderer.kt:1281)
on the perf channel, which the pinned console shows by default — see
Where Field's Output Goes. The Inspector's Renderer card reads the same
snapshot live, refreshed at most once a second
(rendererBrowsing.kt:824,
registered at rendererBrowsing.kt:32).
Coroutine resumes
This is the instrument for your code, and it is the only exact one. A capture wraps the
Runloop's dispatch site (Phased.kt:360)
and the simulation clock uses the same instrumentation. For each resume it owns, it reads a thread CPU counter and a thread allocated-bytes
counter either side of the call. Its unit is one scheduled continuation, which the type
says outright:
One scheduled continuation, ending when it returns/yields/suspends; gaps are not CPU work. —
profiling.kt:27
Most misreadings of the timeline come from forgetting what that sentence says.
A resume is not a frame. It ends at the suspension point, not at the end of your
iteration, so loop { work; delay(16) } produces two resumes per turn round the loop:
one that does the work and suspends, and one that wakes up afterwards and immediately
loops. The second one costs nothing. That makes a median-over-resumes a median over a
population that is half empty, and it is why the panel warns that its percentiles are per
resume rather than per frame. In a three-second recording of the
profiling_timeline demo, the box that allocates an array of 8,192 vectors every
turn showed 314 resumes: 157 that allocated a mean of 229,712 bytes and 157 that
allocated a mean of 208. Its median resume allocated 208 bytes. Its mean allocated
114,966. Neither number is wrong; only one of them is about your work.
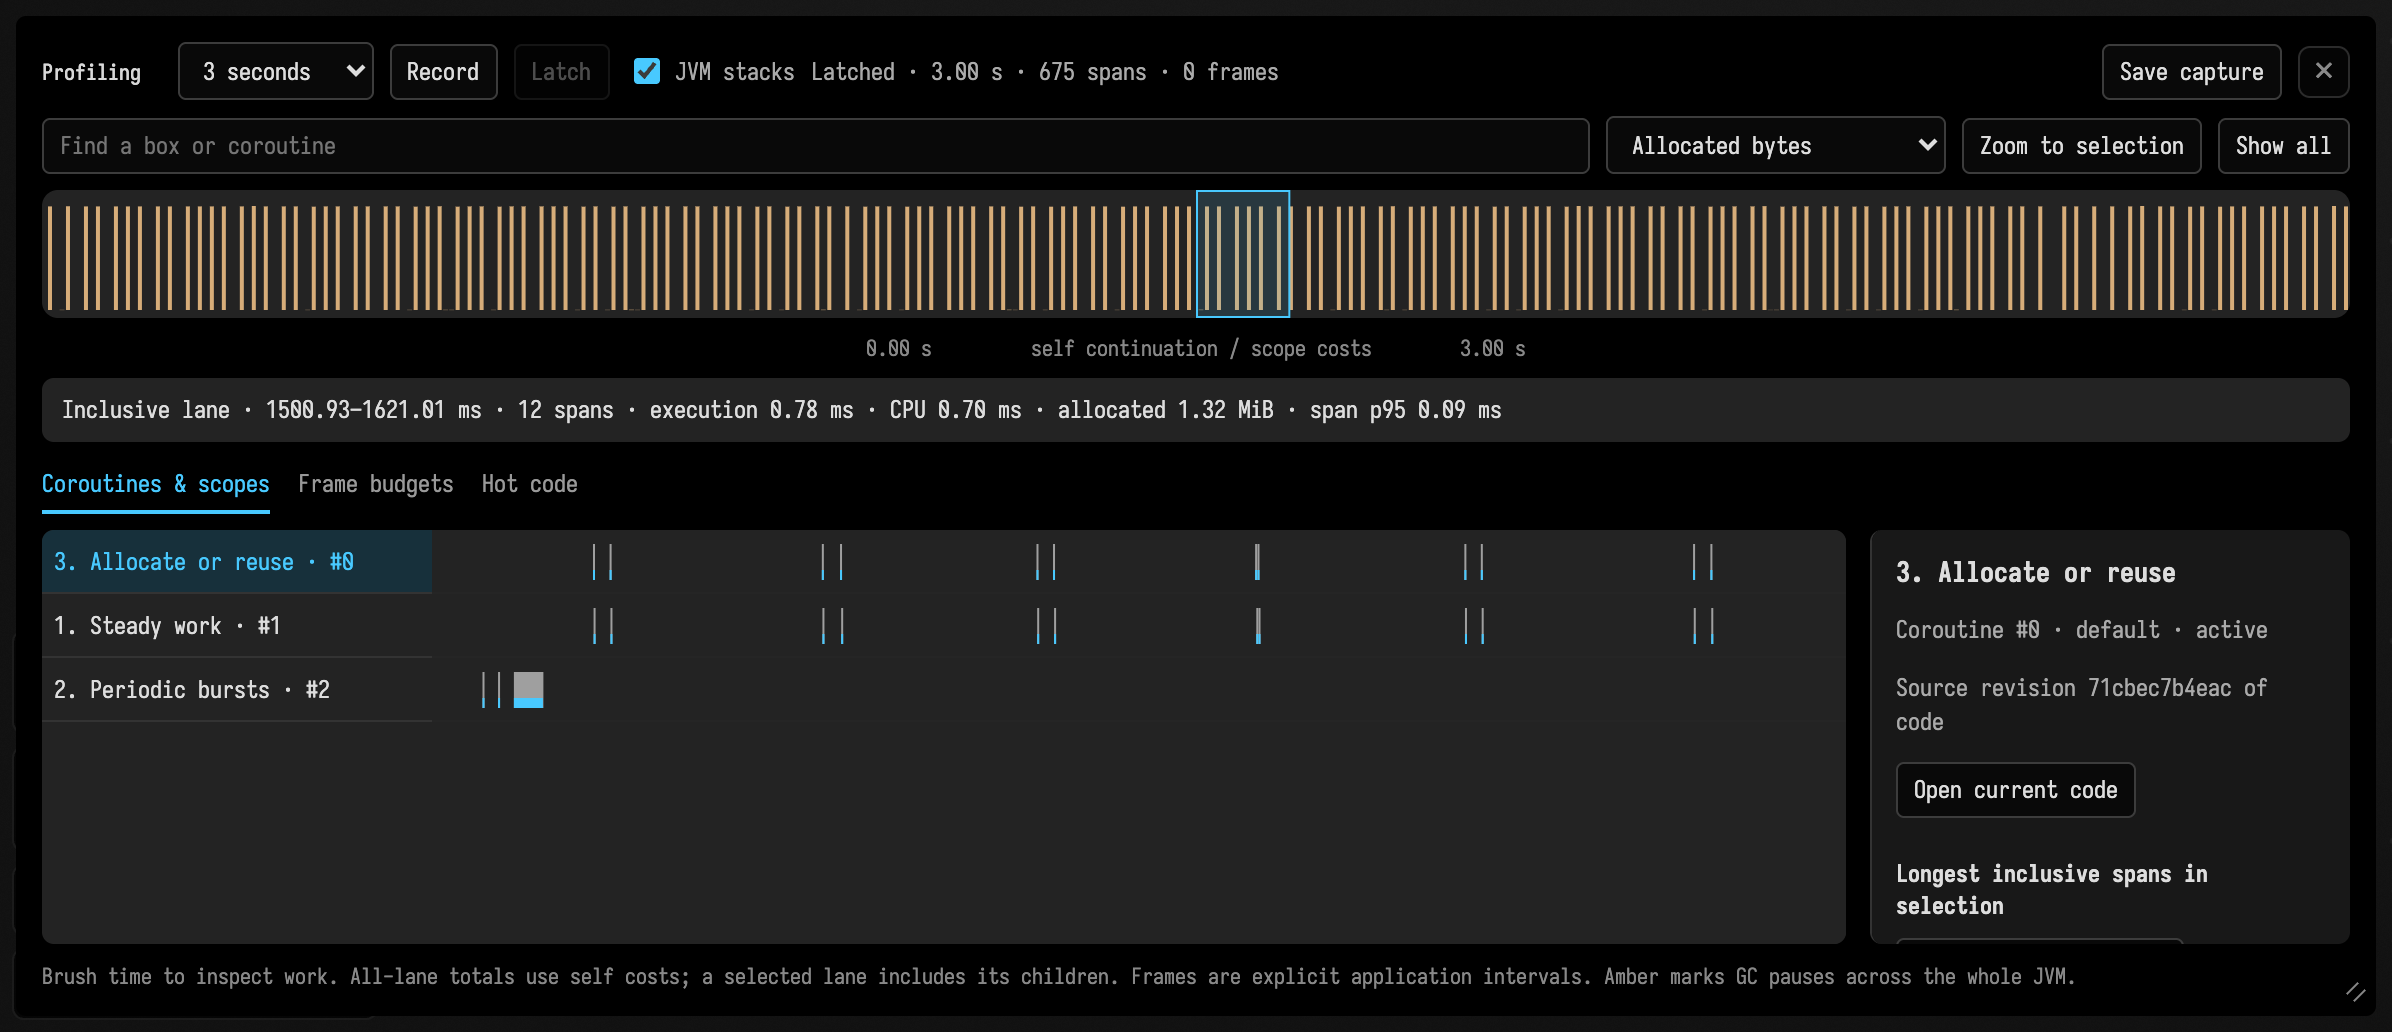
Zoomed to about a tenth of a second of that recording, the vector box's lane shows its
resumes in pairs, two marks close together for every turn of the loop: one resume builds the
array, the other wakes from delay and loops straight back. The summary line counts both, which
is why six turns read as twelve spans.
A gap is not CPU time, and not proof of idleness either. Empty space between spans
means that coroutine was not being resumed by the Runloop. It might be suspended in
delay, it might be blocked in a syscall, it might have moved to another dispatcher.
The instrument cannot distinguish those, because it only ever ran at the dispatch site.
A thread blocked in a syscall looks cheap, not slow. The three numbers are independent:
wallMs encloses everything that happened during the resume, cpuMs counts only scheduled
CPU, and the two are bracketed so that the wall interval contains the counter reads and
cannot come out narrower than them
(CoroutineProfiling.kt:50).
So a resume that blocks for eight milliseconds on a file read reports wallMs ≈ 8 and
cpuMs ≈ 0. That gap between the two numbers is the diagnosis, and it is the reason the
panel draws CPU time as a strip inside the full-width wall bar rather than as a second bar.
In the measured recording the three workload lanes ran at CPU/wall ratios of 0.952, 0.935
and 0.992 — genuinely CPU-bound work, and the absence of the signature.
Allocated bytes is a delta over the whole resume
(profiling.kt:36), so no brush finer than a resume can divide
it, and it is bytes allocated rather than bytes retained. A box can allocate 11 MiB a
second and hold nothing at all, which is exactly what the demo's vector box does.
What it structurally cannot see:
- Anything outside the instrumented dispatchers and scopes. Runloop and
SimulationClockcontinuations carry aProfileOrigin. The origin is attached at launch (Phased.kt:238) and inherited by child coroutines. Work on a renderer thread, a background compile, aDefaultDispatcherworker — none of it reaches the counters. - Field's own work in a box's context. Starting the editor's completion for a box runs on
the Runloop under that box, but it is not the box's code, so it is not charged to the box
(
CoroutineProfiling.kt:52). - Any other document. A resume whose origin belongs elsewhere is run untouched
(
CoroutineProfiling.kt:51), which is a privacy property as much as a scoping one, and only one capture may be live in the process at a time (CoroutineProfiling.kt:70). - Anything past its bounds. Captures run 1 to 30 seconds
(
CoroutineProfiling.kt:69) and keep 65,536 resumes (CoroutineProfiling.kt:104) in a ring that overwrites (CoroutineProfiling.kt:158) across at most 1,024 lanes (CoroutineProfiling.kt:105), refusing the 1,025th (CoroutineProfiling.kt:146). Both losses are reported rather than hidden, in one counter (profiling.kt:63) — check it before trusting a total.
Arming a capture is not free: eleven primitive arrays sized
to the span ring (CoroutineProfiling.kt:119 and its
ten siblings) occupy 5 MiB, plus about 416 KiB for the independent frame ring,
allocated once at the start. Named scope tokens and snapshot exports also allocate during
a capture; compare like-for-like recordings. With no capture
active the dispatch path is one volatile read (CoroutineProfiling.kt:40)
and an origin lookup; no counters are read and no measurement token is allocated.
Note also that the latch drops its references to your live
objects (CoroutineProfiling.kt:176),
and only four documents' captures are kept
(CoroutineProfiling.kt:77).
Explicit application frames and nested work
Add val budget = frameProfile("Game", targetFps = 60.0, allocationKiB = 128.0) inside
an ordinary frames body, call budget.beginFrame() once per iteration, and close it in
finally. These boundaries feed Frame budgets in the existing panel; they do not arm
another capture. See the complete simulation example.
A completed interval runs from one boundary to the next. Its wall time includes suspension, waits, and scheduling gaps. Its CPU and allocated-byte deltas cover the same thread over that interval, including other work sharing it. Keep the instrument on one thread. This makes allocations between your boxes visible, but does not assign them to one stage. An initial boundary has no preceding frame; a final partial interval is discarded.
The panel reports p50, p95, p99 and maximum, alongside counts exceeding your interval budget and allocation guide. Selecting a worst interval keeps the same time brush when you move to scopes or stacks. A single hitch therefore remains directly selectable even when it cannot move p99. The independent frame ring retains 8,192 complete intervals and reports overwritten history.
budget.measure("Collision") { … } and profileScope("name") { … } bracket synchronous
stages. Inclusive costs contain nested children; self costs subtract them. All-lane sums
use self costs, while selecting one lane shows its inclusive cost. Adding inclusive parent
and child values would double-count work.
Frame totals and scope totals are different populations and must not be added together.
GC collection counts and collector time cover the whole JVM over the capture. With stacks
enabled, JFR jdk.GCPhasePause adds up to 2,048 stop-the-world event intervals as amber ticks.
Collector time can include work outside those pauses; neither measure identifies the box
whose allocation caused the collection. An absence of recorded pauses does not prove
that heap allocation is free. Compare bytes per frame and allocation stacks alongside them.
The JFR sampler
The third instrument is optional JFR recording
(JvmProfileCapture.kt:16),
and its type carries the warning the other two do not need:
Samples are statistical evidence, independent of the exact continuation counters. —
profiling.kt:40
Two stack event kinds are enabled, alongside GC pause events. CPU stacks come from jdk.ExecutionSample at a 10
millisecond period
(JvmProfileCapture.kt:22);
allocation stacks come from jdk.ObjectAllocationSample throttled to 150 a second
(JvmProfileCapture.kt:23).
A 10 millisecond period means a sampler that fires 100 times a second per running thread. At 60 fps a frame is 16.7 milliseconds long, so about 1.7 firings land in each frame — but a firing only records your work if your work is what is running when it arrives, so a 2 millisecond hitch has about a one in five chance of appearing in any sample at all, and a single hitch that shows up in no sample is the ordinary case rather than a malfunction.
More usefully, the sampler sees your work in proportion to how much of wall time your work occupies, and that is what sets how long you need to record. The three-second recording measured below was 2.13% busy — 63.9 ms of resume time in 3,002.6 ms of wall clock — and it yielded nine CPU samples. If you want CPU stacks worth grouping, the work has to be happening while you record: a piece genuinely spending half its frame budget in box code will yield a couple of hundred samples in three seconds, and a piece that is mostly waiting will yield a handful however long you record it.
So when the Hot code tab shows a percentage, it is a share of sampled events and not a
share of milliseconds. Two further rules follow from the same fact: an inclusive row counts a sample once per
distinct stack row it contains, so inclusive rows overlap and their weights must never be
added (profileTimelineModel.js:65);
and a gutter stripe is labelled in the panel's own hover text as
lineHeatmap.js:345.
Where an allocation rate's estimate comes from
Allocation sampling has a second layer of estimation on top of the first. The events are
throttled, each carries the
JVM's own estimate of bytes allocated on that thread since the previous event, and the
first event on each thread is discarded because its weight can reach back before the
recording started (JvmProfileCapture.kt:125).
At 150 events a second, ten seconds of a 60 fps piece gives at most 1,500 events spread
across the whole JVM — about two and a half per frame. A per-frame allocation budget read
off that is an estimate from a couple of samples. So if you are setting yourself a budget
in kilobytes a frame, it is a working guide rather than a number the JVM owes you, and the
way to hold yourself to it is the coroutine counters, which are exact, with the sampled
stacks used only to find the line. Field's own stack capture is bounded too: 64 MiB
(JvmProfileCapture.kt:20), a 35-second hard ceiling
(JvmProfileCapture.kt:21),
12,000 retained events (JvmProfileCapture.kt:131),
64 frames per stack (JvmProfileCapture.kt:132)
and 256 source texts (JvmProfileCapture.kt:109).
Where the three disagree
They will. Some worked reasons, so that a disagreement reads as information rather than as a bug:
CPUSpansayspresentcosts 9 ms; no coroutine lane shows anything. Correct and consistent.CPUSpanis wall time on a renderer thread and the coroutine counters never see renderer threads. The cost is not in your boxes.- A lane's
cpuMsis far below itswallMs. Correct and important. The resume was not on CPU for most of its life: blocked, descheduled, or waiting out a GC pause. The span cannot tell you which, and nothing on this page can. - Hot code says a method is 40% and the lane totals say it is 2 ms. Both true. 40% is a share of samples, over the whole JVM in that brush; 2 ms is exact, over one document's resumes. A background thread can dominate the sample population while costing your frame nothing.
- Summed lane wall time is nowhere near the elapsed capture. Expected. The measured recording summed 63.9 ms of resumes over 3,002.6 ms — 2.13%. The rest of the wall clock is suspension, Runloop tasks nobody owns, and everything on other threads. The sum can also exceed elapsed time, because lanes overlap when resumes run concurrently.
- The same box reads differently between two runs. Also expected, and the panel says so. Use identical capture settings, let the scene warm up first, and compare shapes rather than digits.
From "it stutters" to a line of your code
The route, in order, with the branch points named.
1. Decide whose problem it is first. Look at the perf line or the Inspector's
renderer card before you record anything. If CPUSpan's per-frame labels are quiet and
the piece still stutters, the cost is in box code or outside every instrument here. If they
are loud, no coroutine capture will help you.
2. Arm a bounded capture, with stacks on. From the palette, Show Profiling Timeline → a length → Record; from a box, one call, which is what the demo's fourth box does:
CoroutineProfiles.request(thisBox.inside.filename, CoroutineProfileRequest("start", 3.0, stacks = true))Three seconds is usually right. Thirty is the ceiling, and is for a fault you cannot provoke on demand — remember that the ring holds 65,536 resumes, and that a 60 Hz piece with a dozen live lanes can reach that inside twenty seconds.
3. Read the lanes for shape, not for digits. One box can own several lanes, because a lane is a coroutine. What you are looking for is one of three shapes, and they want different fixes:
| Shape in the lane | What it is | Where to go next |
|---|---|---|
wallMs high, cpuMs ≈ wallMs |
real CPU work in your code | Hot code, CPU samples |
wallMs high, cpuMs ≈ 0 |
blocked, descheduled, or a GC pause | not answerable here; move the blocking work off the Runloop |
allocatedBytes high, cpuMs modest |
per-frame construction | Hot code, allocation samples |
| no span at all, just a gap | suspended, elsewhere, or not Runloop-dispatched | check the box is launched and the work is not on its own thread |
Switch the overview to Allocated bytes for the third of those. Remember that the brush includes whole resumes whose start falls inside it, and that bytes cannot be subdivided within a resume.
4. Follow a sample to a named line. Open Hot code, brush the interval you care about, choose Lines, and switch between CPU and allocation samples. Then select the row and read its source. Here is what that showed for the demo, in the same recording. Grouped by innermost frame, the allocation samples ranked:
| sampled weight | events | innermost frame |
|---|---|---|
| 28.87 MiB | 136 | afield.math.linalg.LinalgKt.vec |
| 1.98 MiB | 9 | the vector box's own line 12 |
| 1.92 MiB | 9 | kotlinx.coroutines.EventLoopImplBase.scheduleResumeAfterDelay |
and grouped inclusively by box line, the top row of the vector box was line 12, 30.85 MiB across 146 samples, whose text is:
positions = Array(count) { vec(it.toFloat(), phase, 0f) }That is the whole workflow in one row: a per-frame allocation, named by line, in a box.
Notice that the two groupings are consistent rather than contradictory — vec is the
callee and line 12 is the caller, which is exactly the difference between Top frame only
and Including callees, and exactly why the two columns must not be added.
In the same capture the periodic burst box — the one costing
2.2 ms every 240 ms, which is by far the largest single cost in the recording — was
represented by one sample, on its line 7, with no measurable allocation. Sampling found
the allocation problem immediately and very nearly missed the CPU problem entirely. The
lane's exact wallMs found the CPU problem in the first second.
5. Jump to the box with the gutter heatmap on. Open box with gutter heatmap puts you in Monaco with the sampled lines striped in the gutter, cyan for CPU and amber for estimated allocation. The stripes vanish in one case that surprises people, and the matching rule below explains why.
A capture's source records carry more than a path. ProfileStackSource
(profiling.kt:50)
also carries a boxId, a property and a copy of the box's source text as it was when the
capture was armed — enough to tie a sampled frame back to a box, and only strings, so a
latched capture retains no live box or classloader
(JvmProfileCapture.kt:45).
The heatmap then requires all three to match what the editor currently has open
(profileTimelineModel.js:55):
the same box, the same property, and character-identical text. Two boxes holding
identical code do not borrow each other's marks, and — the part that surprises people —
editing a single character clears the stripes, because the capture is now about code that
no longer exists. Undo the edit and they come back. That is the right trade, and it is
better than a stale stripe pointing at a line that has moved.
For frames outside any box, the resolver goes to the checkout instead, and checks the
package and SourceFile attribute rather than guessing from a simple class name
(JvmProfileCapture.kt:154).
Expect most resolved source to be Field's own code rather than your box: that is where most
of a sampled stack's frames are.
What these measurements miss
If none of the three explains your dropped frames, look here.
- GPU execution.
submit_gfxis only the cost of submitting. The renderer's Vulkan timestamp profiler measures the GPU work; open it from the Inspector on a window context. - GC pauses. In a resume they show up as unexplained wall time, with
wallMshigh andcpuMsnear zero. With JVM stacks on, the timeline marks pauses with amber ticks. - Retained memory.
allocatedBytesis allocation, not occupancy; a box can churn tens of MiB a second and retain nothing. - Native and GPU memory. Neither counter covers them.
- Scanout.
Renderer.frameCountercounts renderer iterations, not frames the display actually presented. Dividing it by elapsed seconds gives you an iteration rate, which is a useful number and is not a measured frame rate.
Seeing the renderer's own spans
present and record_gfx are the renderer's labels, and you will see them only by
running ./gradlew runJvm with a window open and reading the perf line. A docs
capture runs a box in a headless Field with no Renderer, where CPUSpan.snapshot()
returns zero labels, so the figure above drives CPUSpan.time under a label of its own
instead. The window arithmetic, the percentile indexing and the 500-sample truncation
are the renderer's own code either way, and are exercised for real.
Try it
The profiling_timeline starting point needs no GPU. Open it as in Try the demo,
then change one thing, in box 2. Periodic bursts: shorten quietMillis from 240 to 16,
relaunch it, and record again. The lane's wallMs per resume should barely move (each
burst still costs about the same 2.2 ms), while the number of bursts in three seconds goes
from a dozen to something near two hundred. A per-resume percentile tells you how
expensive one turn is; only the number of turns tells you whether the work fits in a frame.
The same box with the same p99 can be cheap or far too expensive depending on how often
it runs.
For the panel's controls, and for the brush, the lane list and the save format, see Explore a capture above.