GPU State — keeping a simulation on the card
There are two compute-shader examples in these docs already. Field 4
Graphics §3 writes an input buffer, dispatches a ComputeMesh, and reads
the answer back; §3b keeps the answer on the card and draws it from a second box. Field
Probes instruments the same scene and photographs it: a hundred thousand soft
quads turning slowly, and a live histogram of their speeds.
They have something in common that neither of them has to mention. In both, the compute shader reads
inData and writes outData, and inData is the same buffer, holding the same numbers, on frame
one and on frame ten thousand. The animation comes entirely from a scalar pushed in from Kotlin. That
is a stateless shader: a pure function of a fixed input and a clock, evaluated fresh every frame.
Almost nothing you actually want to simulate is like that.
The moment a particle has a velocity, this frame's answer depends on last frame's answer, and a set of questions arrives all at once that a stateless shader never has to face. Where does the state live, given that both the CPU and the GPU write it? What is it before frame one? Which buffer is "current", and how does a second box find out? And when the force law itself is the thing you are editing, how do you change it without stopping?
This page works through those decisions in a running simulation.
The running example is the gpu_state starting point: three boxes, 40,000 particles held on a noise field, a force law you can retype while it runs, and a GPU-side histogram of speed. The last section says how to open it.
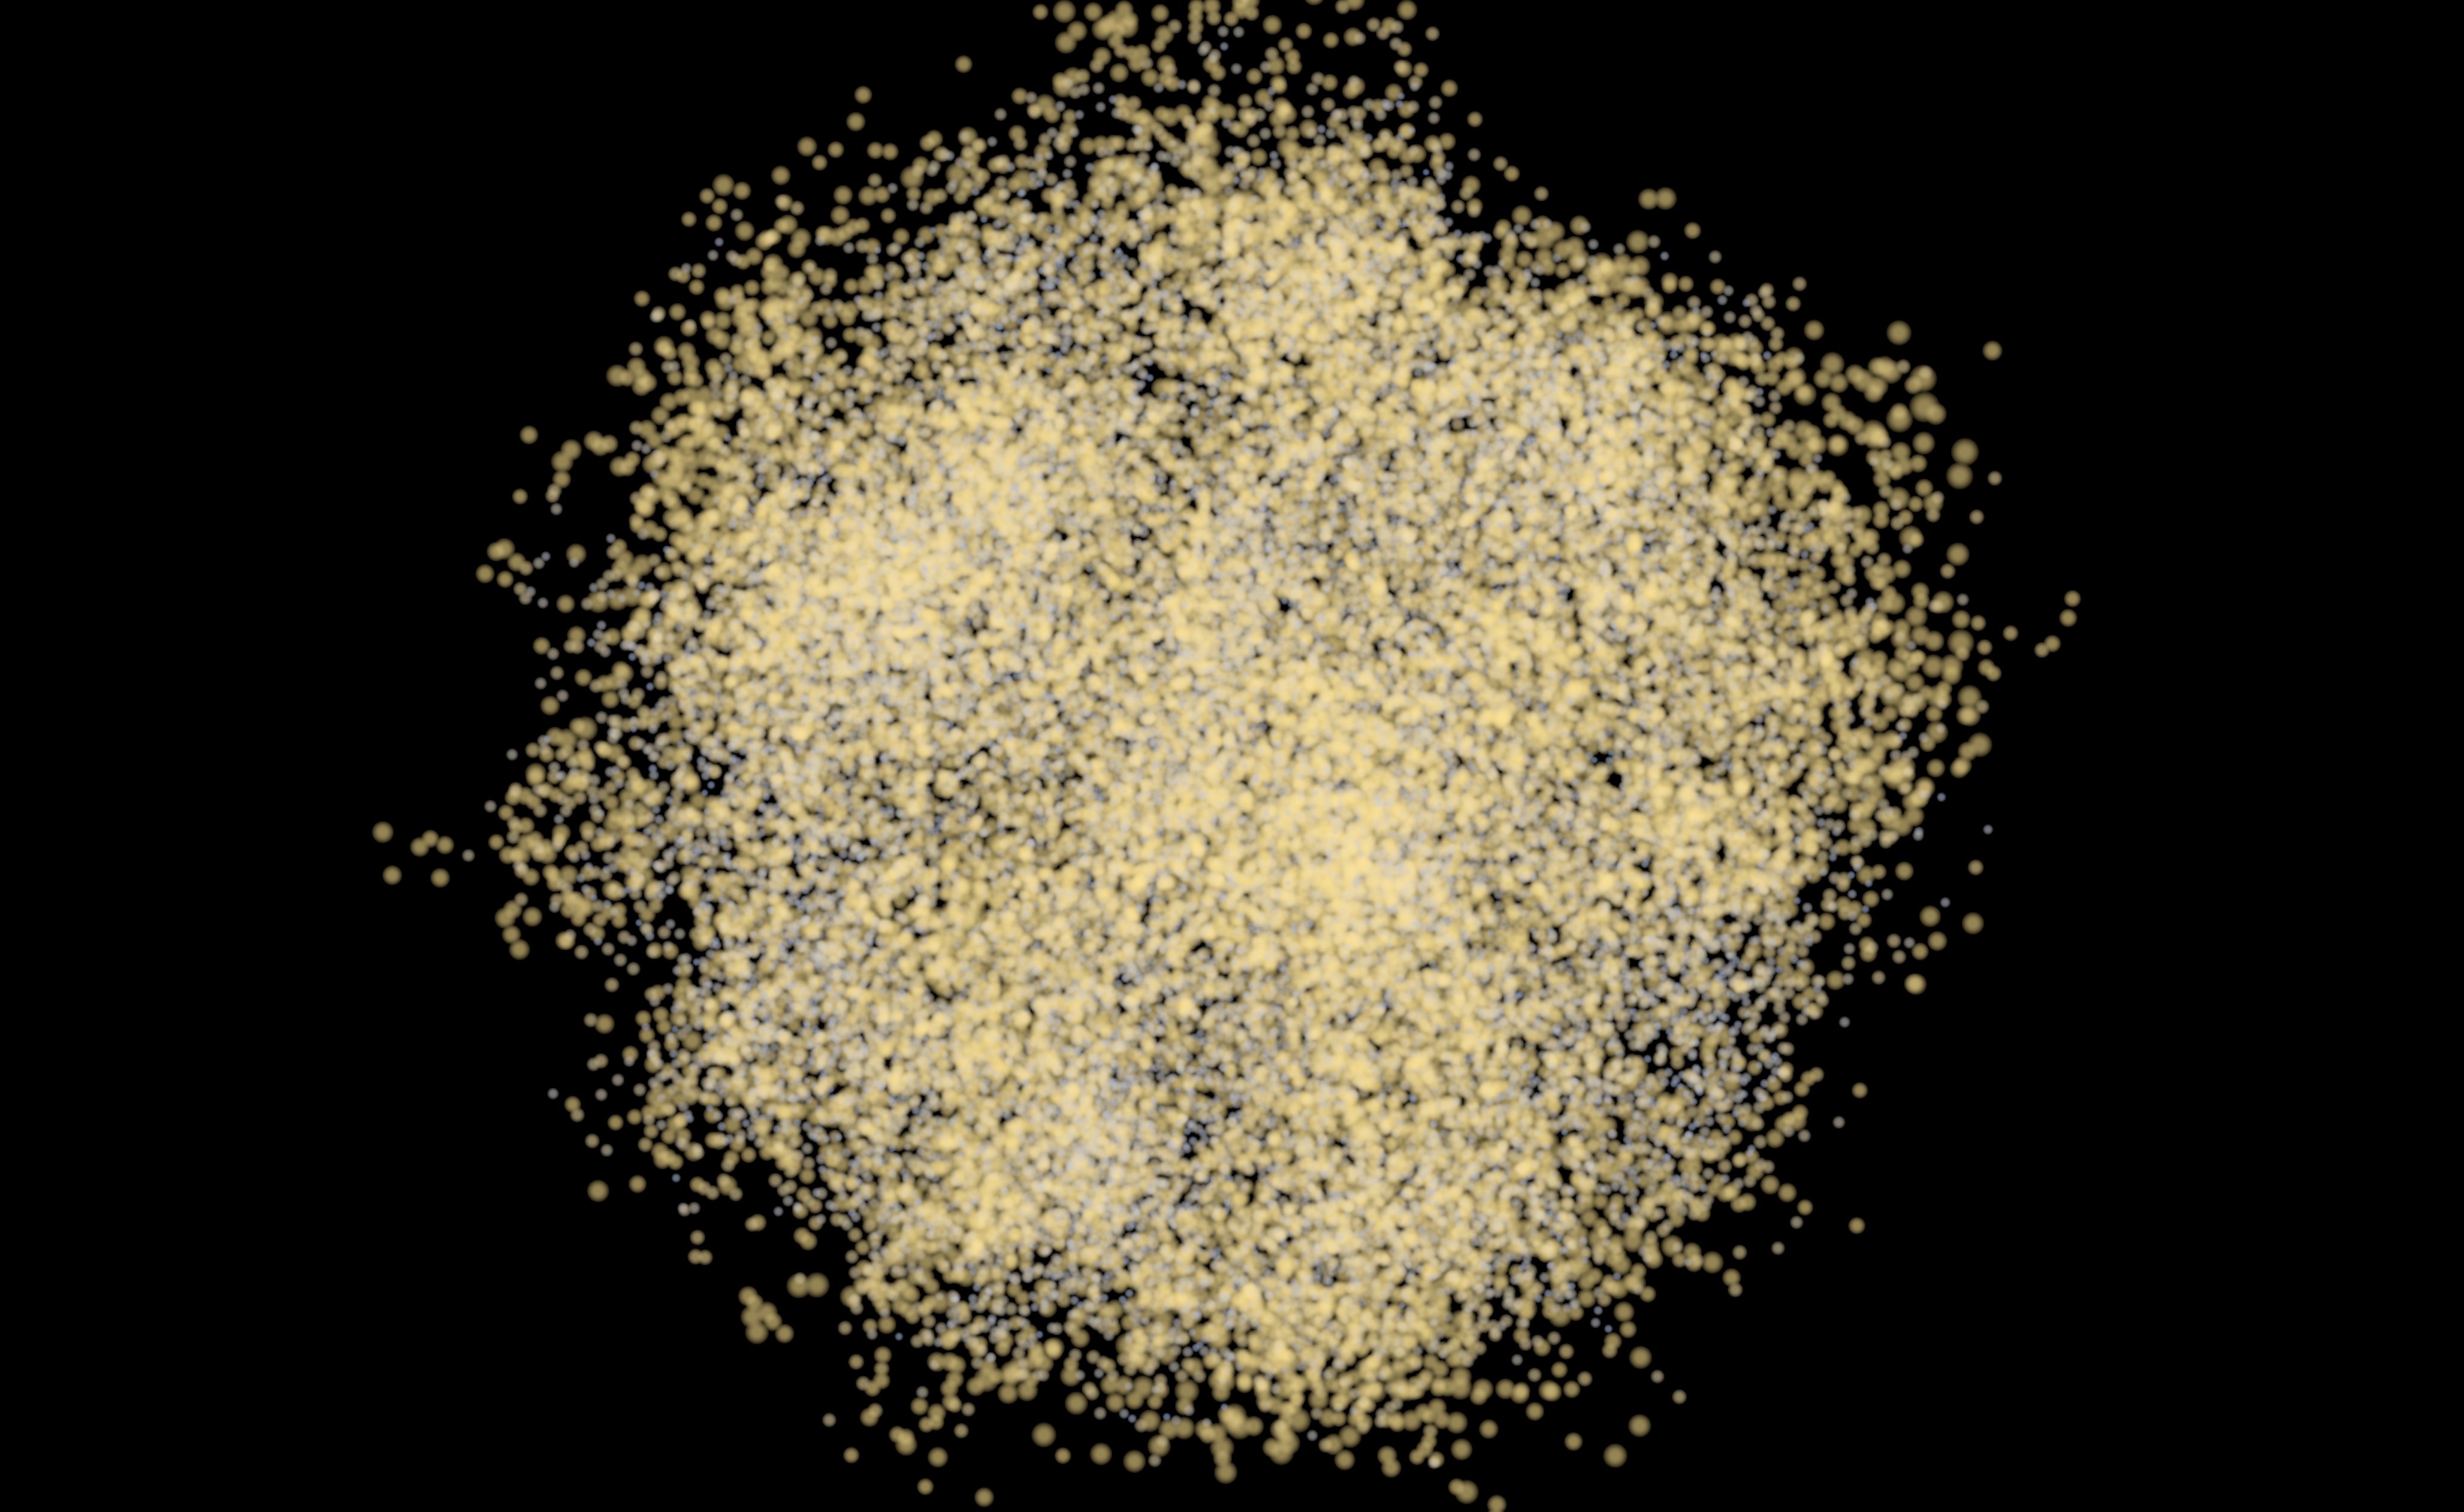
Warm is fast and cool is slow (the colour is a smoothed per-particle speed the shader keeps in a buffer nobody ever uploaded), and the holes are where the noise field pulls particles apart faster than the spring can bring them back. Nothing in that picture is computed by the CPU. It holds forty thousand positions, forty thousand velocities and forty thousand smoothed speeds, and per frame it does no per-particle work at all.
Where a buffer lives
defaultBuffer is the first thing every compute example calls, and every existing example calls it
the same way:
var inData = defaultBuffer { size = N.vec4s }.bufferIt is a good default: defaultBuffer gives you a buffer that is host-visible, usable as a storage
buffer, and addressable by buffer_reference
(src/jvmMain/kotlin/afield/graphics/vulkan/buffers/magic.kt:25). On a machine with resizable
BAR a buffer can be all three at once, so for most examples one line is enough.
It is enough right up until you have four buffers instead of two, and they are not alike. Inside the block you can say what this particular buffer is for, and the vocabulary is small:
| you write | what it means | what you are saying about the access pattern |
|---|---|---|
| nothing | host-visible | the CPU and the GPU both touch this, repeatedly |
writeOnce() |
device-local, staged upload | written once from Kotlin, read by every invocation of every frame |
zeroInit() |
device-local, zeroed by the device | never uploaded at all; the shader owns it from the first frame |
streamReads() |
host-visible and host-cached | the CPU reads this back regularly, so it must not be write-combined |
debugReads() |
device-local with a readback staging path | the CPU reads it occasionally, when you are looking |
All five are members of the buffer block, in the order above:
src/jvmMain/kotlin/afield/graphics/vulkan/buffers/magic.kt:93,
src/jvmMain/kotlin/afield/graphics/vulkan/buffers/magic.kt:106,
src/jvmMain/kotlin/afield/graphics/vulkan/buffers/magic.kt:143,
src/jvmMain/kotlin/afield/graphics/vulkan/buffers/magic.kt:136 and
src/jvmMain/kotlin/afield/graphics/vulkan/buffers/magic.kt:126
(zeroInit() and debugReads() are aliases for the last two). None is more than half a dozen lines:
each sets an access pattern and some memory-property bits.
Each one is a claim about who writes the buffer and how often, and the wrong claim is a real cost paid
every frame. streamReads() exists because a readback out of write-combined memory on an NVIDIA card
is slow enough to dominate a frame, and zeroInit() exists because uploading forty thousand zeroes
over PCIe to say "start at nothing" is absurd when the device can do it for free.
The example has one of each of the first three:
val N = 40000

// State is host-visible: written once below, then written by the compute shader every frame.
// Staging it would be a lie about the access pattern.
var stateA = defaultBuffer { size = (N * 2).vec4s }.buffer
var stateB = defaultBuffer { size = (N * 2).vec4s }.buffer
// Anchors are writeOnce(): written here, read by every invocation of every frame, which is
// exactly what device-local memory is for.
var anchors = defaultBuffer {
    size = N.vec4s
    writeOnce()
}
    .buffer
// Heat is zeroInit(): never uploaded at all. The device zeroes it and the shader owns it.
var heat = defaultBuffer {
    size = N.vec4s
    zeroInit()
}
    .buffer
(N * 2).vec4s is the sizing idiom, and it reads as the layout it describes: two vec4s per
particle, one for position and age, one for velocity. vec4s is a vec4-count-to-bytes conversion on
the buffer block, and vec3s returns the same number, because std430 expands a vec3 to sixteen
bytes and pretending otherwise is how buffer overruns happen.
Both halves of the ping-pong
A shader cannot read and write the same location across invocations without a barrier, and it certainly cannot read a neighbour's previous value once someone has overwritten it. So state simulations keep two buffers and swap which is which every frame. Read the old one, write the new one, swap, repeat.
The trap is the second buffer's contents before the first frame.
// BOTH halves of the ping-pong. The shader reads one and writes the other from frame one, so
// an unwritten second buffer means the first frame integrates from zeroes.
for (target in [stateA, stateB]) {
    target.write {
        for (h in home) {
            put(vec(h.first, h.second, h.third, 0.0)) // position, age
            put(vec(0.0, 0.0, 0.0, 0.0)) // velocity
        }
    }
}
It is very natural to write "the initial state" once, into stateA, and think the job is done. It is
not: on frame one the shader reads prevState, and on frame one exactly half the time that is
stateB, which nobody has written. Whatever the allocator handed you (commonly zeroes) is what
frame one integrates from.
Run the example with [stateA] in that loop and the picture survives it. Every particle spends
frame one at the origin, the restoring force in this scene pulls each one back to its anchor, and
after that the two runs are not merely similar, they are on the same trajectory
(GPU_STATE_MEASUREMENTS.md
has what the probe read from each of them).
That makes the bug worse, not better. A bug whose only symptom is one bad frame at startup is a bug that hides, and it hides here only because this scene has a spring in it that forgets its initial condition. Take the spring out (a pure advected flow, a cloth with no rest length, anything accumulating into a history buffer) and nothing forgets it: frame one's zeroes stay in the simulation for as long as it runs.
Bindings are lambdas
A ComputeMesh member holds a lambda, which Field evaluates once per dispatch rather than once at
assignment:
sim.state = { if (renderer.frameCounter % 2L == 0L) stateA else stateB }
sim.prevState = { if (renderer.frameCounter % 2L == 0L) stateB else stateA }
sim.anchors = { anchors }
sim.heat = { heat }
sim.count = { N }
sim.dt = { 1f / 60f }
sim.knobs = { vec(renderer.frameCounter / 60.0, 1.0, 0.0, 0.0) }
That is what makes the ping-pong work at all: nothing re-binds the buffers per frame, because the binding is the question "which one is it this frame", asked afresh at every dispatch.
It is also why these lines belong exactly where they are: at the top level of the box, run once, and
not inside a loop {}. A binding set inside the frame loop lands a frame late, and a dispatch in
that window throws MissingRefException saying the member has not been assigned yet. Set them once,
outside; they stay live because they were lambdas from the start.
sim.dt = { 1f / 60f } is a fixed timestep rather than a measured one. A spring network's stability
is a function of dt, so feeding it the real frame interval means a hitch in the renderer becomes an
explosion in the simulation. Once dt is fixed, the clock the force field walks through has to come
from the same place (renderer.frameCounter / 60.0 and not the wall) or the integrator and the
field are running on two different timebases in one loop. Sixty steps is one second by definition, and
a slow frame then slows the field instead of tearing it. It also makes the figure at the top of this
page reproducible, since the docs capture waits a fixed number of frames and a fixed number of frames
is a fixed simulated time.
One parity source, asked twice
The draw box is a child of the compute box, and it reads what the compute box publishes:
prop<FrameBufferGroup>(gsStateA) = stateA
prop<FrameBufferGroup>(gsStateB) = stateB
prop<FrameBufferGroup>(gsHeat) = heat
Both halves, and not just the current one, because the draw box has to ask the same parity question the compute box just asked:
quads.state = { if (renderer.frameCounter % 2L == 0L) gsStateA else gsStateB }
quads.heat = { gsHeat }
Two boxes computing the same predicate is cheaper than sharing one. renderer.frameCounter
(src/jvmMain/kotlin/afield/graphics/vulkan/Renderer.kt:784) is constant for the whole of one
frame's recording, so both boxes get the same answer no matter which one's binding is evaluated
first. A counter that one box owns and increments and the other reads is the same predicate with an
ordering dependency bolted to it, and it goes wrong exactly when the two boxes are launched in
different frames, which is to say every time you re-run one of them by hand.
Get the parity backwards in the draw box and the picture is one frame stale rather than broken, which looks entirely correct until the simulation is fast enough to alias.
The force law as an editable string
Everything above is scaffolding. The thing you actually iterate on is the force, and recompiling a shader to change a coefficient is a bad loop.
{{ stack.auto.NAME }} is Field's answer: a slot in the GLSL whose body is a
StackSL program, assignable as a property from Kotlin. StackSL
Examples teaches it as a fullscreen image filter. It works the same way in a
compute shader, and in a simulation it is the difference between editing a force law and rebuilding
one.
layout(push_constant) uniform dat {
    State state; // this frame's half of the ping-pong — written
    State prevState; // last frame's half — read
    Anchors anchors; // written once, read every frame, device-local
    Heat heat; // zero-initialised, device-local, shader-owned
    vec4 knobs; // .x seconds, .y force gain
    uint count;
    float dt;
} pc;

// The live slot.
{{ stack.auto.force }}
Field places the generated function after the push-constant block even if the slot line is written
above it, so a program can read a push member with ?pc.knobs. Until Kotlin binds it the slot is the
fallback vec4 force(vec4 force_in) { return vec4(0.0); }, so an unbound slot still compiles and the
field simply sits still.
Kotlin then assigns it on the module, not the mesh:
simModule.force =
    """
    : vfield
      >c
      <c                     fbm4
      <c [11.3,4.1,7.7,0]  + fbm4
      <c [2.9,17.7,13.3,0] + fbm4
      vec3
    ;

    input [7.0,7.0,7.0,0.048] * vfield
    0.5 - 6.0 *
"""
A stack.auto slot is a property of the compiled shader, so it is set on the module; the mesh only
carries push constants, and sim.force = … fails with a note saying so.
Changing that string and hitting run costs nothing. Field lowers the StackSL to GLSL, patches this module's pipeline on a background thread, and leaves the old binding in place if the new one does not compile. No shader reload, no dropped frame, and a typo cannot take the field down.
Three details of that program matter.
fbm4, and not fbm. StackSL's plain fbm is two-dimensional. It lowers to fbm(vec2) over
coord.xy + coord.zw * 0.07, so a single call fed a 3D position gives you a field in (x, y) with
z entering at a fourteenth of the weight of x: a shear, not a third dimension. Summing three sheared slices, f(x,y) + f(y,z) + f(z,x), costs
three fbms and is still three 2D fields rather than one 3D one. Use the volumetric family instead
(noise3, fbm3, fbmd3, warp3, curl3, worley3, noise4 and fbm4), which reads
input.xyz, or the whole vec4, as a real coordinate. The
StackSL Cheatsheet has the table.
fbm4 rather than the three-dimensional fbm3 because this field has to move. The shader hands the
program vec4(anchor, pc.knobs.x) — position in .xyz, the clock in .w, which is StackSL's own
input convention — so input [7.0,7.0,7.0,0.048] * sets the spatial scale and the rate the field
evolves at in one componentwise multiply. Time as a fourth axis of the noise, rather than an offset
added into a 3D one, is a volume changing in place instead of sliding past.
The failure the two-dimensional version produces does not look like a slightly worse version of the
right answer. Here is the identical scene with the slot bound to input xyz 2.0 * fbm x 0.5 - 8.0 *,
one 2D fbm and nothing else, and no other line changed anywhere:
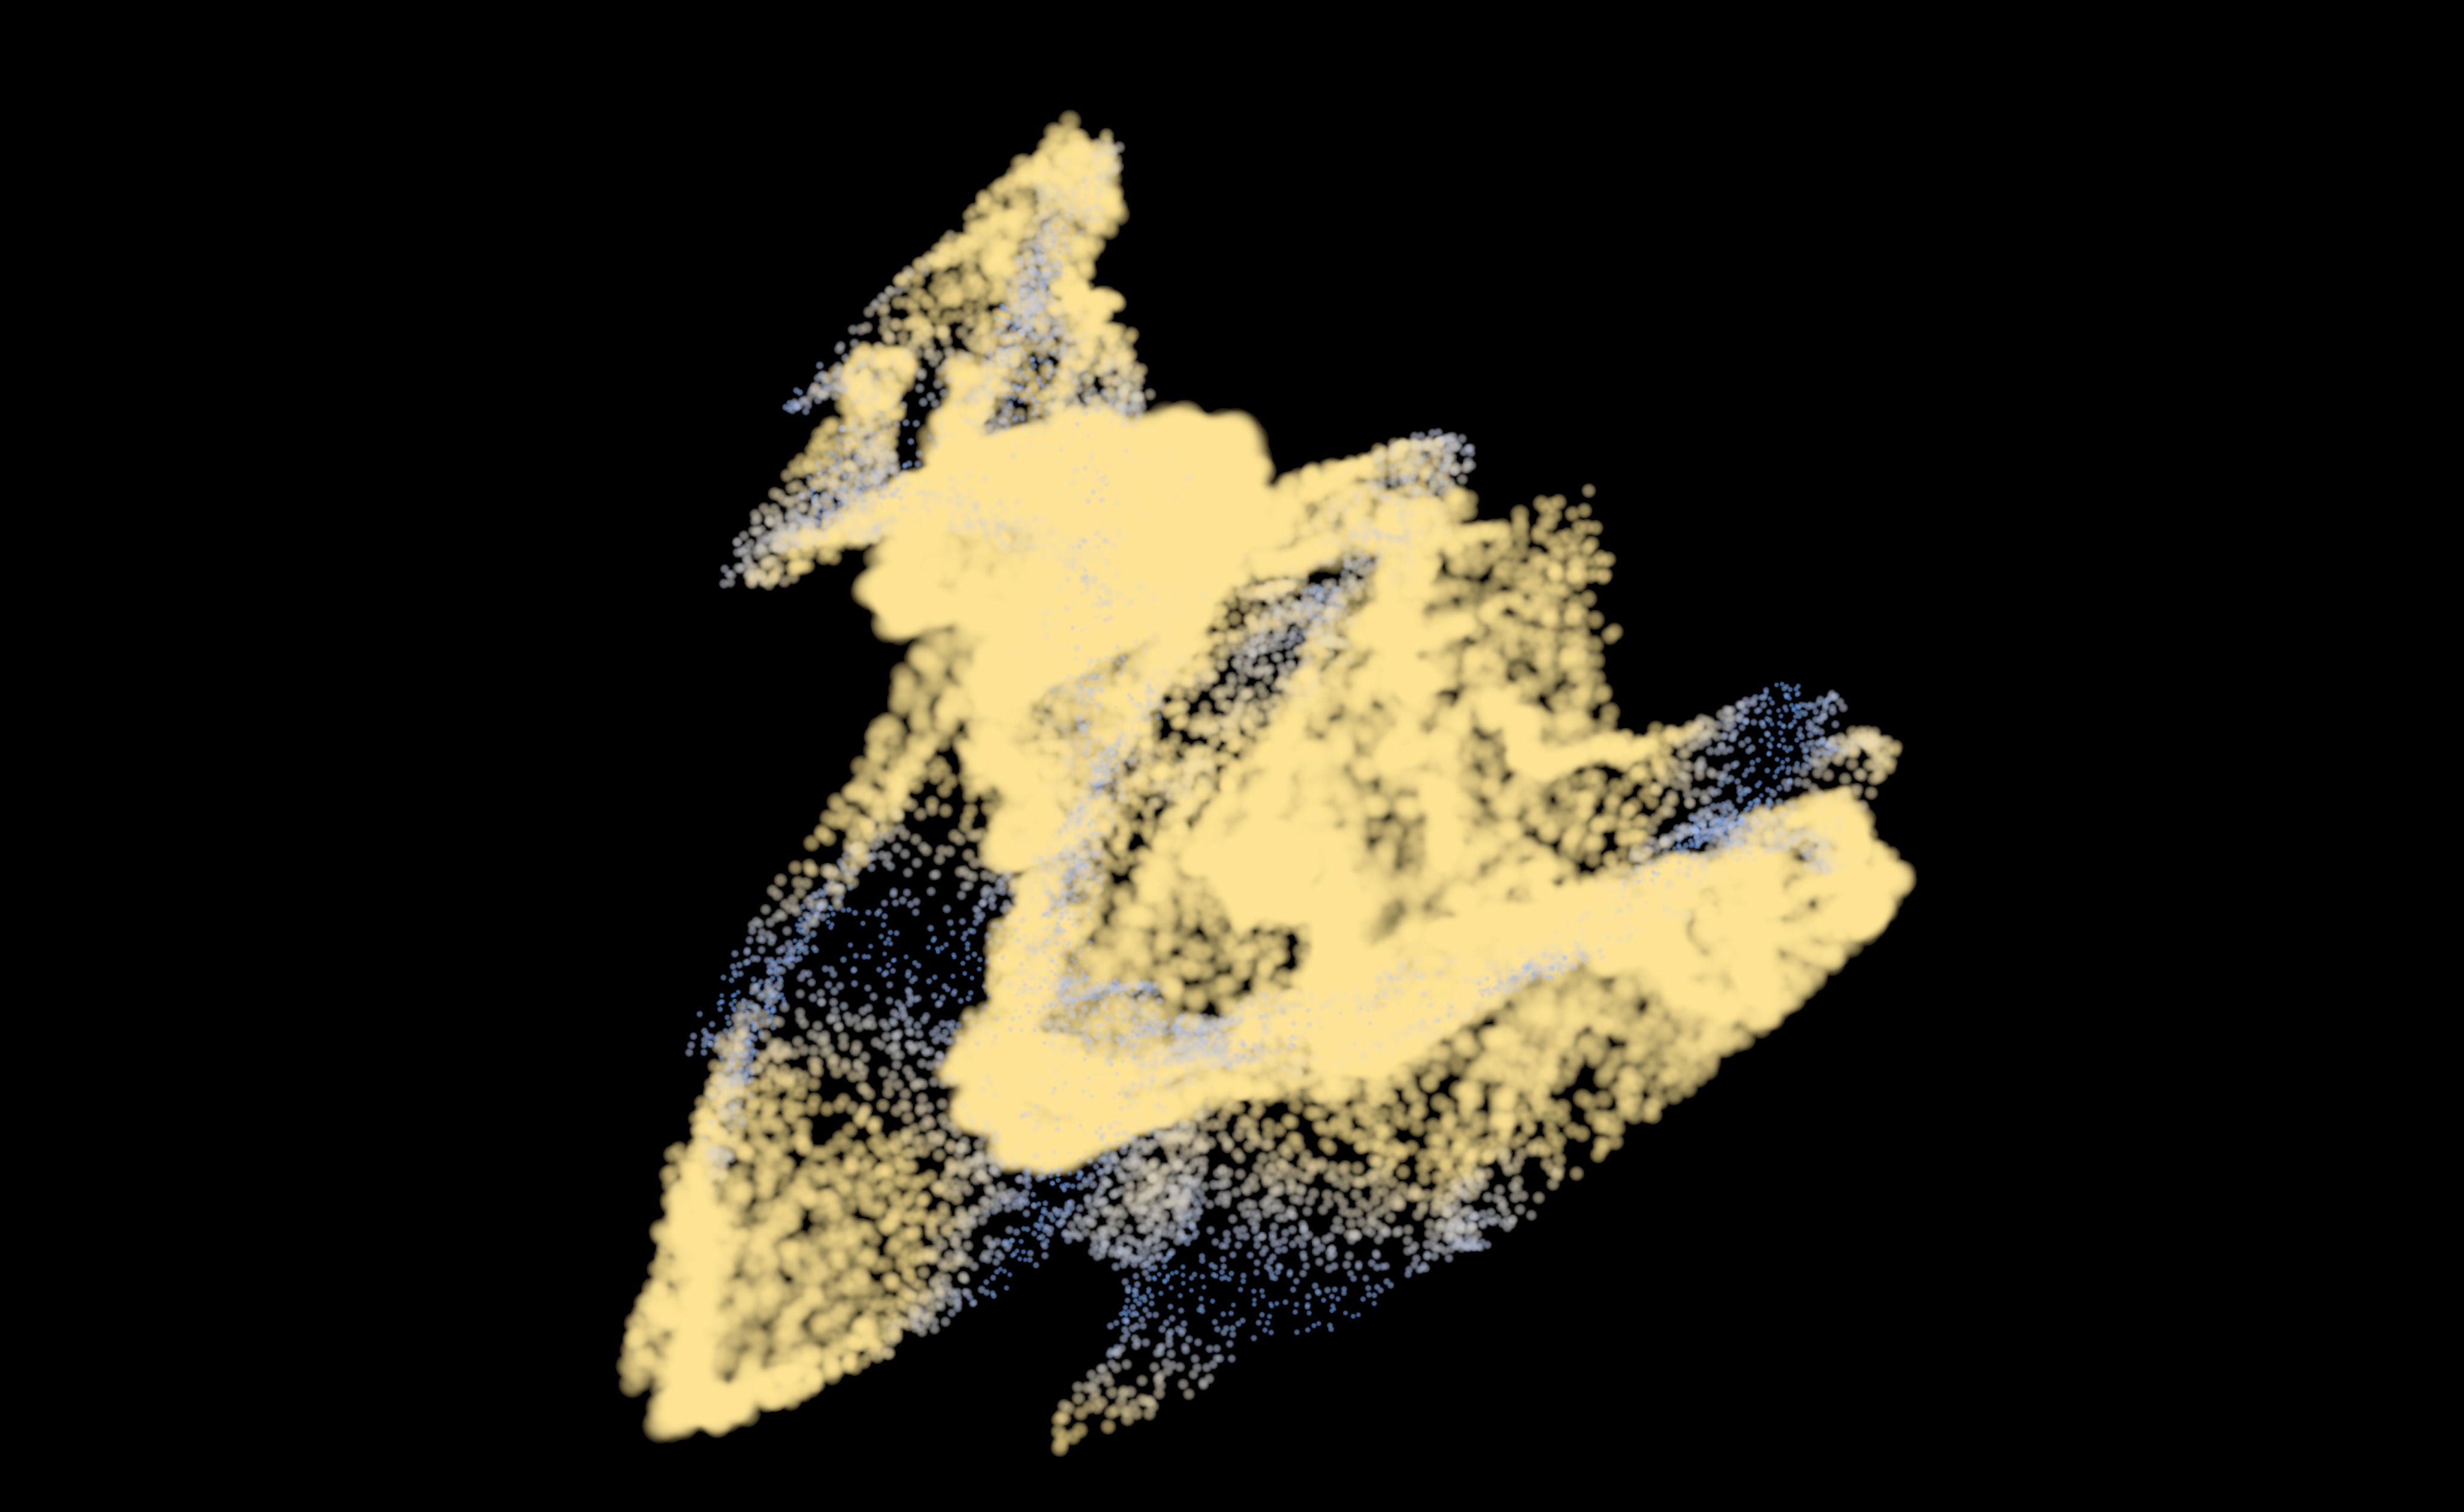
A scalar fbm broadcast to all three components is the same push on every axis, so every particle
moves along the same diagonal, by an amount that varies in only two of the three. Instead of a
noisier disc you get folded sheets with hard creases where the shear reverses, and
the whole thing is dragged bodily off-centre. The drag comes from a bias, which is the next point.
Nothing in the program corrects a bias. fbm's five octave amplitudes sum to 0.96875 rather than
1, so a raw 2D fbm runs 0 to 0.96875 and the usual 0.5 - leaves about −0.016 per channel. A
constant force integrates into a drift rather than averaging out, and a drift with nothing to stop
it is a cloud leaving the window — the figure above is what that looks like with the bias left in and
the restoring force too weak to hold it. Every fractal word in the 3 and 4 family accumulates
its amplitude sum in the shader and divides it out
(src/jvmMain/kotlin/afield/lang/stacksl/VolumetricNoise.kt:330), so fbm4 is exactly 0..1
for any octave count, lacunarity and gain, and 0.5 - is unbiased. A correction of 1.032258
(1 / 0.96875) belongs only in front of a 2D fbm; with the family there is no constant to
remember.
>c and not =c. A definition must consume its input and leave its result. =name copies
(a -- a), >name moves (a --); opening vfield with =c leaves the input underneath the result,
so every call pushes two values and everything downstream takes the wrong operand. The compiler emits
no error; it prunes the surplus and carries on.
It does say so, though. Every bind builds a report and publishes it to the box's stack.auto output
channel (src/jvmMain/kotlin/afield/graphics/shader/shaders.kt:532),
opening the card when there is something to say and closing it again when a later bind comes back
clean. Swap >c for =c in the box above and the channel opens with this, verbatim:
problem: definition `vfield` ends with 2 values on the stack, not 1 — it must consume its input
         and leave its result. `=mark` copies (`a -- a`), `>mark` moves (`a --`); everything
         after an unbalanced definition takes the wrong operand.
The report does not stop the bind: the slot still binds, because a program is usually mid-edit. You can also ask before you bind: stackAutoShaderReport(program, "force")
(src/jvmMain/kotlin/afield/graphics/shader/shaders.kt:545) is pure, needs no device,
and returns the same object.
The program above never reads the push block, because the clock reaches it on input.w; for
anything else from it (the force gain, a mouse position) the syntax is ?pc.knobs y. An external read
of any member type works, a float or vec2 widened to a vec4 the way a swizzle would, and a
spare vec4 of knobs (clock in .x, gain in .y) lets you add a knob without touching the shader.
Watching it without reading it back
The state buffers hold 120,000 vec4s. Copying that to the CPU to find out whether the simulation is
alive would cost more than the simulation.
fieldProbeHere does not:
fieldProbeHere(samples = 4096).display("probe")
displayOpen("probe")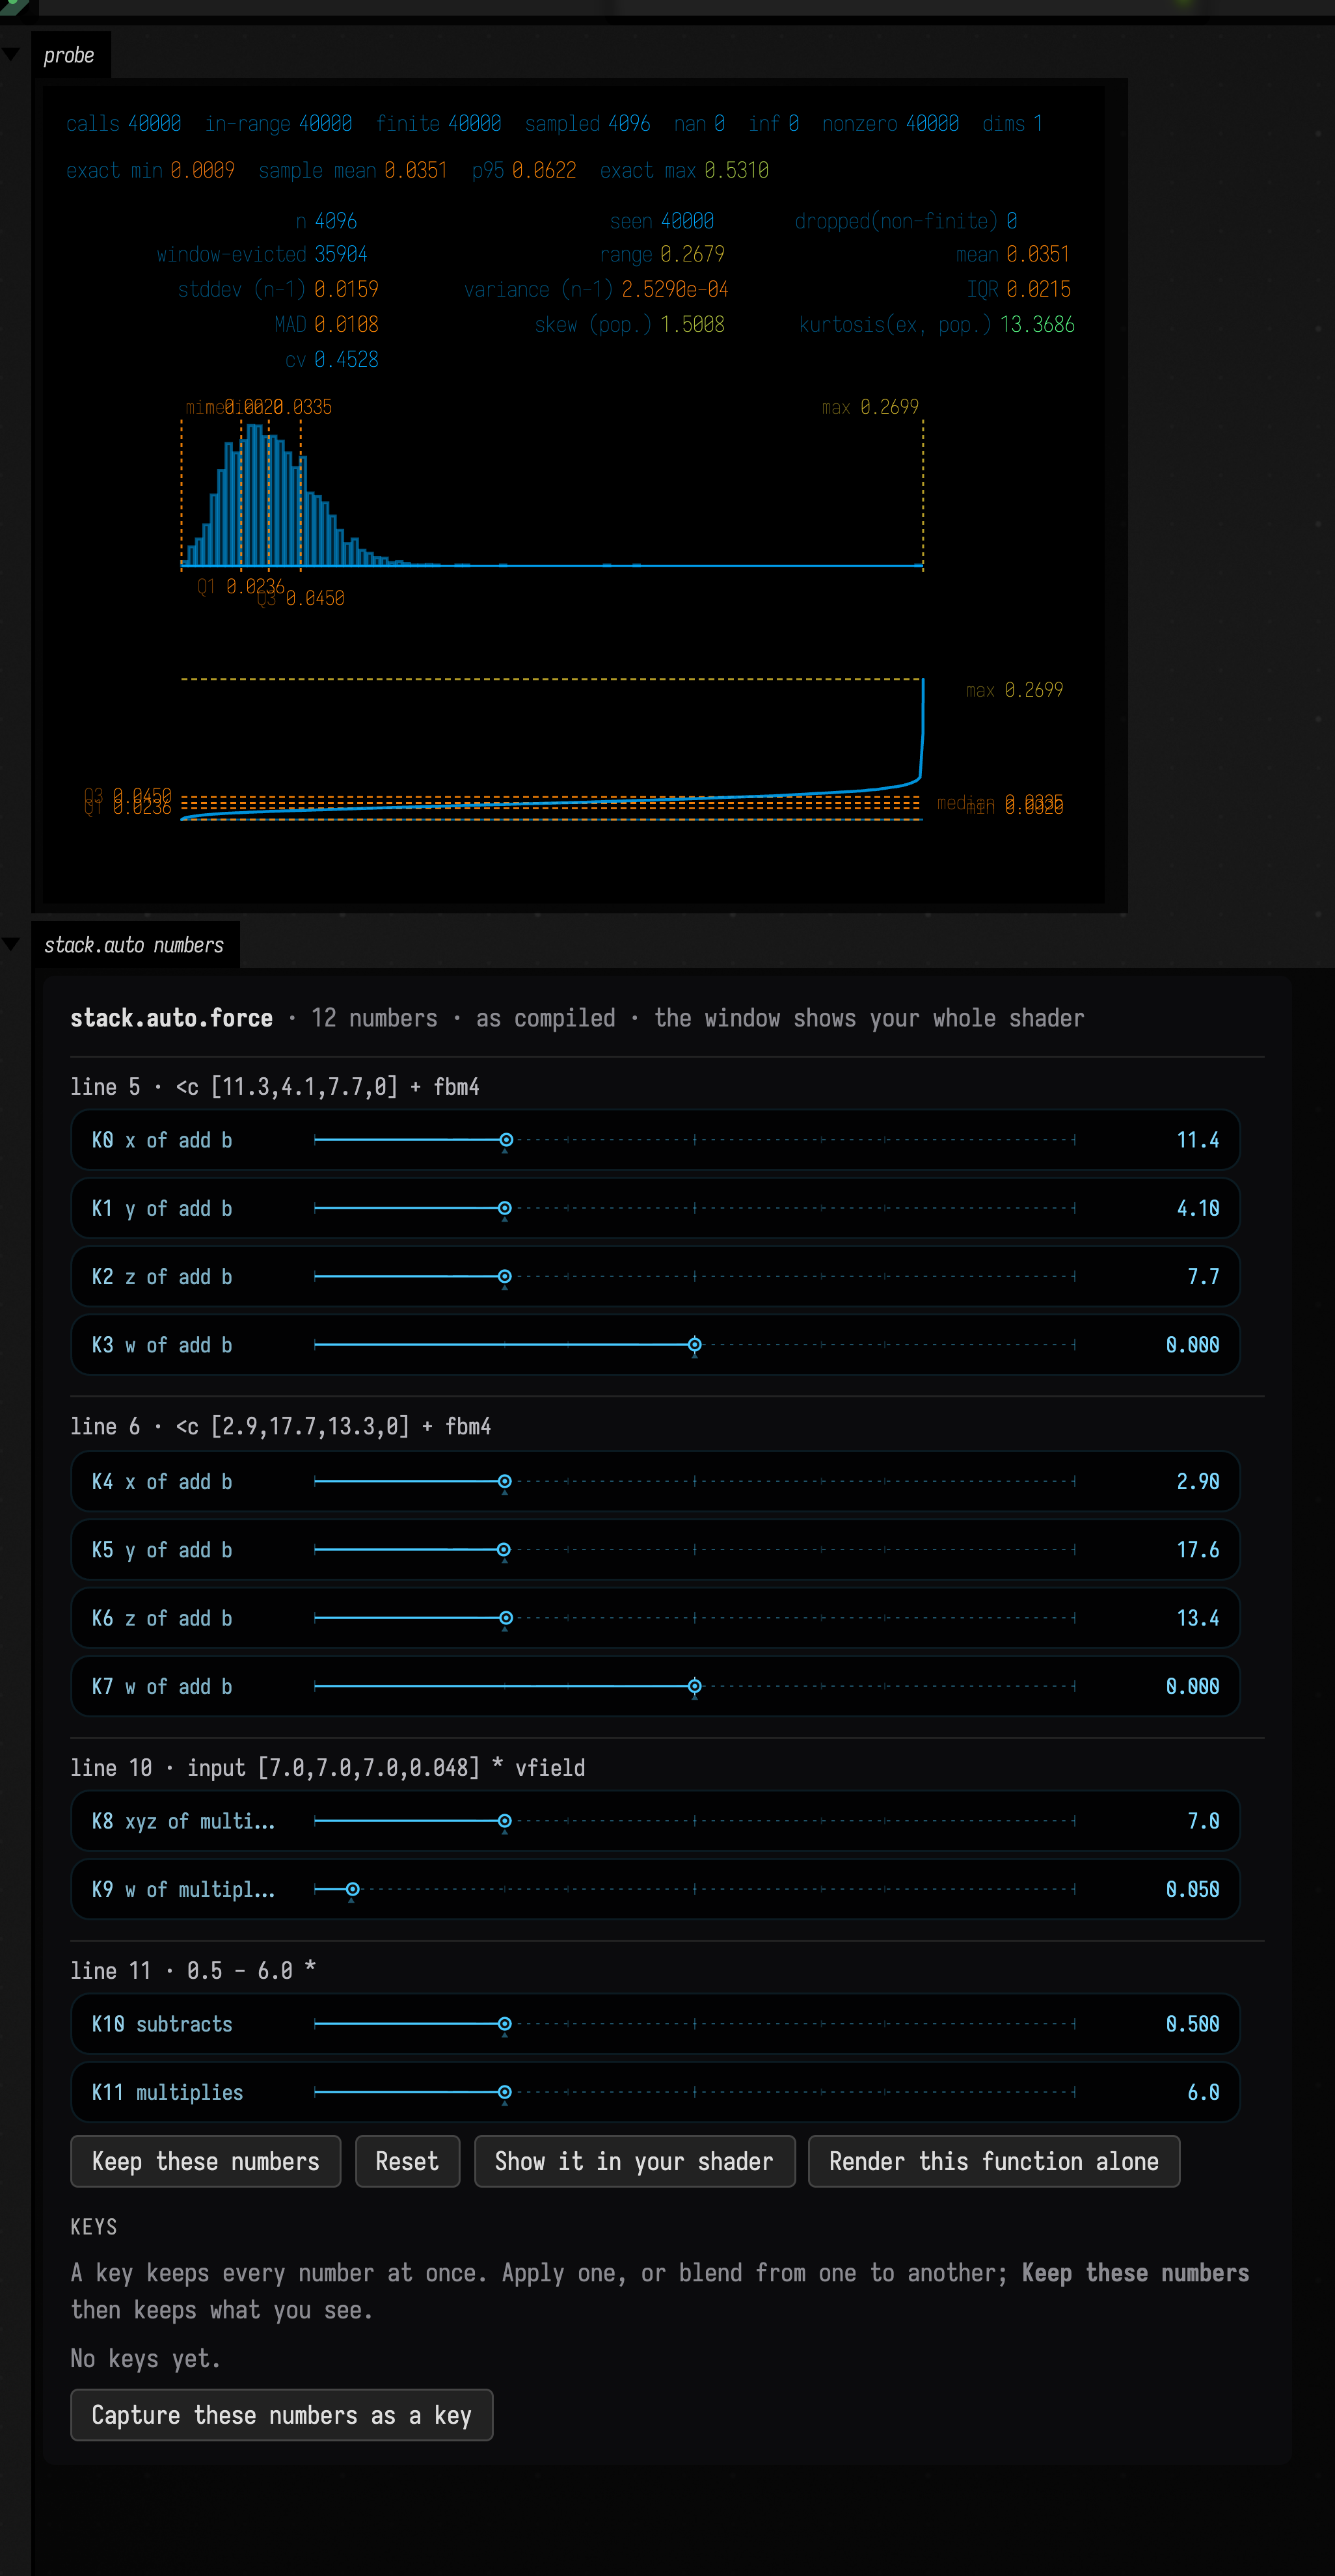
plus one call in the shader, fieldProbe(speed), next to the value while it is in scope. The shader
keeps exact counts and exact min/max with atomics and reservoir-samples the raw values, so what comes
back per snapshot is a few thousand numbers rather than a few hundred thousand. The reservoir is
what makes those few thousand an unbiased sample of the whole population, rather than whichever few
thousand invocations happened to run first. Field Probes is the full account,
including the GPU-only sibling fieldStats.
For the scene above, that card reports 40,000 calls, all finite, none NaN, over a reservoir of 4,096.
Those four never move. The mean per-particle speed and the exact maximum do, because the noise field
does: in the card above they read 0.047 and 0.21, and dev_docs/GPU_STATE_MEASUREMENTS.md has the range
they held over it. What you do with them is turn the force gain up and watch the mean leave that
range, or watch the maximum
not move because a clamp is firing, while you are still typing. A readback would tell you the same
thing and you would never leave it switched on.
Open it
It ships as a starting point, so the shortest route is the welcome screen, or open the document directly:
Three boxes appear and a window opens. The knobs worth turning, in the order they teach something:
simModule.forceon the simulate box, a livestack.autoStackSL slot. Retype it while it runs and the module rebinds on a background thread without dropping a frame. Bindinput xyz 0.9 *for a plain outward push and the disc inflates and stops; the shipped program instead holds it on a noise field.- The scale inside that program. Change the
7.0s ininput [7.0,7.0,7.0,0.048] *to3.0or14.0— the same field coarser or finer. This is the knob that decides whether the picture reads as blobs or as filaments, and the fourth component is the rate it evolves at. - Make it fail. Open
vfieldwith=cinstead of>cand the box'sstack.autochannel opens withproblem: definition \vfield` ends with 2 values on the stack, not 1. Or bindinput xyz 2.0 * fbm x 0.5 - 8.0 *— one 2Dfbm` over a 3D position — and watch the disc collapse into the stripes the figure above shows. - Name a definition after a builtin and it refuses.
: fbm3 … ;does not shadowfbm3, it is an error:Definition 'fbm3' shadows a built-in StackSL word. If you retype the three-slice sum to compare it, give the word a name of your own. sim.knobs, whose.xis the clock the noise walks through and.ythe force gain. Both are lambdas, so both are live.
Agents: replaying the transcript
To replay it from a script without the browser, run the transcript through the backdoor:
uv run --project . --group backdoor python tools/field_backdoor.py --port 9483 --graphics-context \
  --command "transcript write gpustate --file dev_docs/agents/transcripts/gpu_state.yaml" \
  --command "transcript run gpustate"
The example's README lists every knob and what each one does to the picture.
Where to go next
- Field 4 Graphics — the contract underneath all of this: modules, meshes, reflected names, push constants, and the stateless compute examples this page follows.
- Field Probes —
fieldProbeandfieldStatsin full, on a sibling particle scene. - StackSL Examples and the StackSL Cheatsheet — the language in the force slot, its vocabulary, and the arity rule the report above is checking.
- Frames and the Animation Loop — what
frameCounteris counting, and what aloop {}does that makes a binding inside one land late.