How to write Javascript in Field
While Field is "normally" a self-contained Python development environment there are many times when this is not the case. Sometimes what you need to write isn't Python, and sometimes where you need to execute it isn't Field. In the Processing Plugin Field wraps up any code you write and "sends" it to a running Processing applet. In the Max Plugin Field literally sends your code across a network socket to a running Max/MSP process. Various application integration tricks work like this. A standard philosophy emerges:
- send code to execute rather than just data.
- support Field's notion of "animation" — the ability to start and stop boxes — if you can. It's a good idea for work in Field, it's a good idea when working with other applications too
- support Field's autocomplete and introspection hooks — once you've started using it it's hard to stop.
- if you can bridge the namespaces between the two environments (see the MaxPlugin and the scripting languages support).
Recently, we've realized, that there's no good reason why these approaches cannot be used to bridge Field to another platform — Javascript in a web-browser.
- The source code in this tutorial is longer and more complicated than most pages. It's all included in this tutorial.
Here's a couple of videos to see where we are heading:
The Online Plugin
In the latest build / source tree for Field there is a new plugin — "Online". Adding this plugin to Field (see here) gives you an embedded web-browser. To gain access to this server:
from field.online import OnlinePlugin
server = OnlinePlugin.server
How do we serve a page with this server? First we need some html:
from field.online import OnlinePlugin
server = OnlinePlugin.server

server.init = """
<html>
<body>
Hello World
</body>
"""
Execute that and we are ready to serve up a web page straight out of Field:
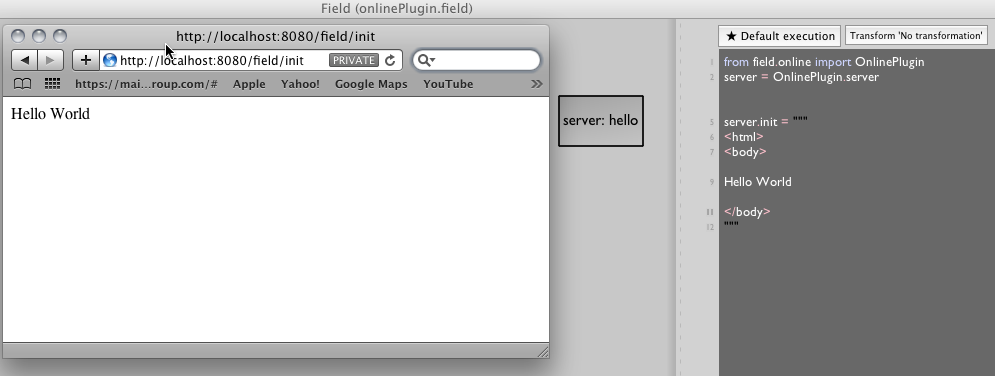
(Click to enlarge). The URL is http://localhost:8080/field/init and the source code is exactly what you'd expect.
So far, so good. Let's serve a more interesting webpage:
server.init = """
<html>
<head>

<script language="javascript">
"""+_self.javascript_v+"""
</script>
</head>
<body>
<canvas id="canvas" width="300" height="300"></canvas>

</body>
"""
This page does two things. Firstly, it adds a lump of Javascript that's stored in a property javascript_v — we can edit that in a separate "tab" of the text editor. Secondly it adds a canvas element.
What Javascript should we serve? Let's build up something interesting. In the Javascript_v property of this element let's have:
var bootURL = "/field/boot";

function evalRequest(url) {
     var xmlhttp = new XMLHttpRequest();
     xmlhttp.onreadystatechange = function() {
        if (xmlhttp.readyState==4 && xmlhttp.status==200) {
            try{
                 setTimeout(xmlhttp.responseText, 0);
            }
            catch(e)
            {
                console.log(e);
            }
        }
     }
     xmlhttp.open("GET", url, true);
     xmlhttp.send(null);
 }

evalRequest(bootURL)
AJAX gurus will recognize this is a fairly straightforward asynchronous request for another webpage, specifically "/field/boot" — that's where we're going to write the Javascript "operating system" that's going to interface with Field.
The source code at "/field/boot" (which you can set at server.boot) will look like this:
var _field = {
    log : function(s) {
        var xmlhttp = new XMLHttpRequest();
         xmlhttp.open("GET", "/field/print?text="+encodeURIComponent(s), true);
         xmlhttp.send(null);
    },
    error : function(s) {
        var xmlhttp = new XMLHttpRequest();
         xmlhttp.open("GET", "/field/error?text="+encodeURIComponent(s), true);
         xmlhttp.send(null);
    },
    send : function(address, obj) {
        var xmlhttp = new XMLHttpRequest();
         xmlhttp.open("GET", address+"?data="+encodeURIComponent(JSON.stringify(obj)), true);
         xmlhttp.send(null);
    }

// other _field functions go here

}

function evalRequest(url, next) {
     var xmlhttp = new XMLHttpRequest();
     xmlhttp.onreadystatechange = function() {
        if (xmlhttp.readyState==4 && xmlhttp.status==200) {
            try{
                window.eval.call(window, xmlhttp.responseText);
            }
            catch(e) {
                console.log(e);
                _field.error(e.message+" on line:"+e.line);
            }
            evalRequest(next, next)
        }
     }
     xmlhttp.open("GET", url, true);
     xmlhttp.send(null);
 }

evalRequest("/field/start", "/field/update")
We'll build up some special functions in a "namespace" _field as we go through this document. The functions here log, error, send work in conjunction with Field embedded server to handle inspection and printing.
But right now the important thing is the new definition of evalRequest — this is an XML long poling loop. This a way of enabling a web-browser to "continue the conversation" with the server long after the server has finished serving the initial page. Browsers are continually asking for some text at url "/field/update" and, when they get it, they execute it as javascript and ask again for "/field/update". The server can take as long as it likes getting back to the browser — the browser is waiting for this text asynchronously.
Executing Javascript just like anything else
The upshot of these two things — the magic in Field's webserver and the xml long polling on "/field/update" is that we can now execute Javascript in web-browsers just like we execute Python code in Field itself — incrementally, experimentally, and with inspection.
First, just as in the Max/MSP plugin or the Processing Plugin case, we mark the box as being "bridged" to a different environment.
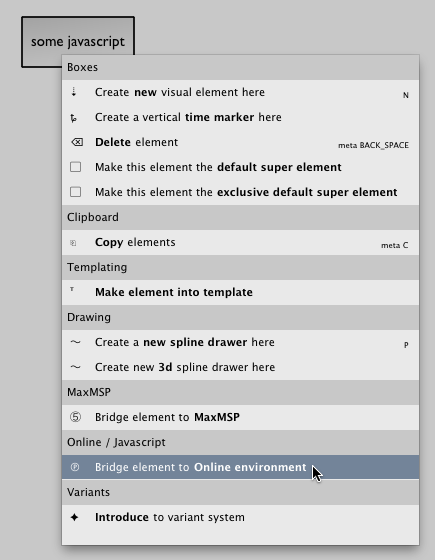
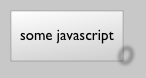
These boxes are now marked with an "O" badge:
Using the functions defined in _field we can check that everything is working. Execute this code inside this box (using any of the ways you normally execute code in Field — command-zero, select-command-return, option-click etc...
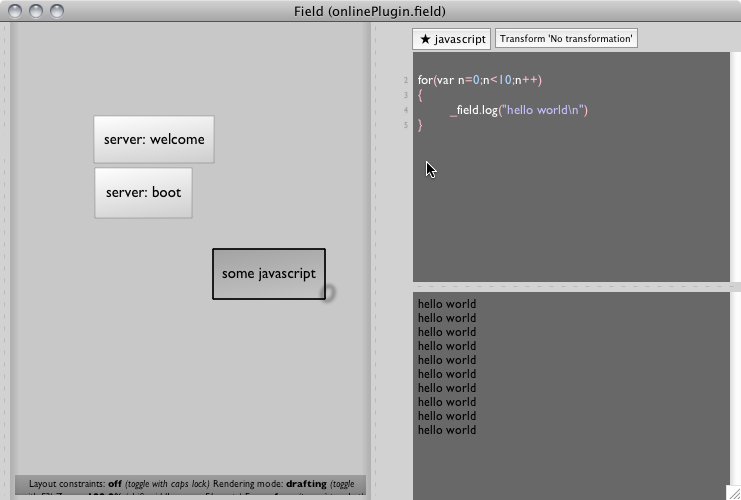
Remember: in order to see anything at all you have to have a browser open at "http://localhost:8080/field/init" — the code is being executed "inside" (any) browsers that are connected to Field — no browsers, no code execution. If you open two browsers on "http://localhost:8080/field/init" you'll find 20 lines of "hello world" printed, not 10.
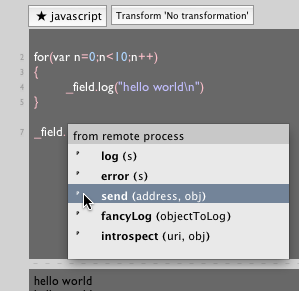
You'll also find that autocomplete works (command-period):
What's happening under the hood
Clearly, there's a little bit of magic going on. While the xml long polling is part of it, there's on extra ingredient — the server journal. Like the Max/MSP plugin, the code is going some place outside Field's process to get executed. But in this case there may be zero, one or more than one site of execution and, worse, these execution hosts may come and go at will. What to do when a browser connects while Field has been running, and executing, Javascript for a while? Since Javascript commands may change arbitrary program state there's only really one thing to do — send everything that's ever been executed piece by piece to the web-browser that comes late to the party.
Fun with HTML 5 canvases
What can we do with this functionality right now? You may remember that as part of the html page we served up at the beginning we included this line:
<canvas id="canvas" width="300" height="300"></canvas>
That makes a 300x300 pixel drawing canvas with id canvas. Everybody knows that you can draw to these canvases directly in Javascript, but drawing to these canvases incrementally is much more fun. Let's start, execute:
var ctx = document.getElementById("canvas").getContext("2d")
That digs canvas out of the document that we served, and assigns it to ctx. Now we can execute things like
ctx.strokeStyle = "rgba(0,0,0,1.0)";
ctx.beginPath()
ctx.moveTo(10,10)
ctx.lineTo(100,100)
ctx.stroke()
Yields:
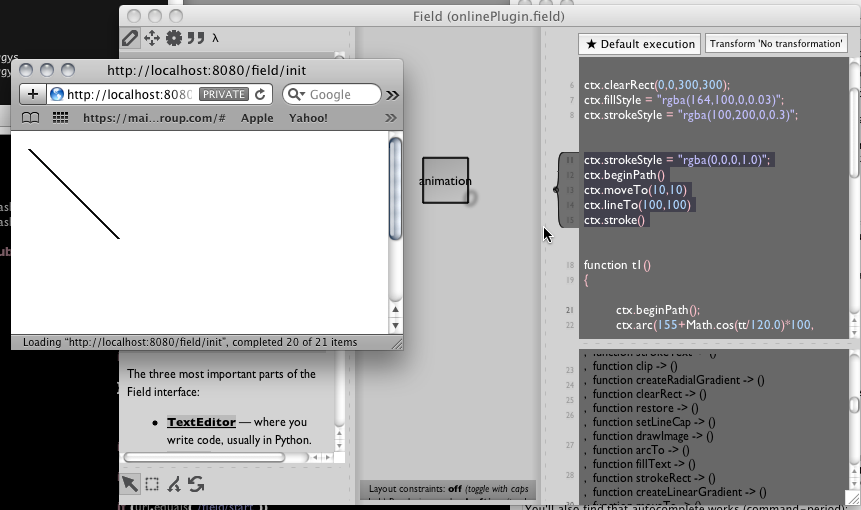
Again, it's important to keep the the correct execution model in your head, since Field is going to great lengths to make the infrastructure disappear. This code here, for example:
var ctx = document.getElementById("canvas").getContext("2d")

ctx.strokeStyle = "rgba(0,0,0,0.5)";
ctx.clearRect(0,0,300,300)

for(var n=0;n<10;n++)
{
    ctx.beginPath()
    ctx.moveTo(100*Math.random(), 100*Math.random())
    ctx.lineTo(100*Math.random(),100*Math.random())
    ctx.stroke()
}
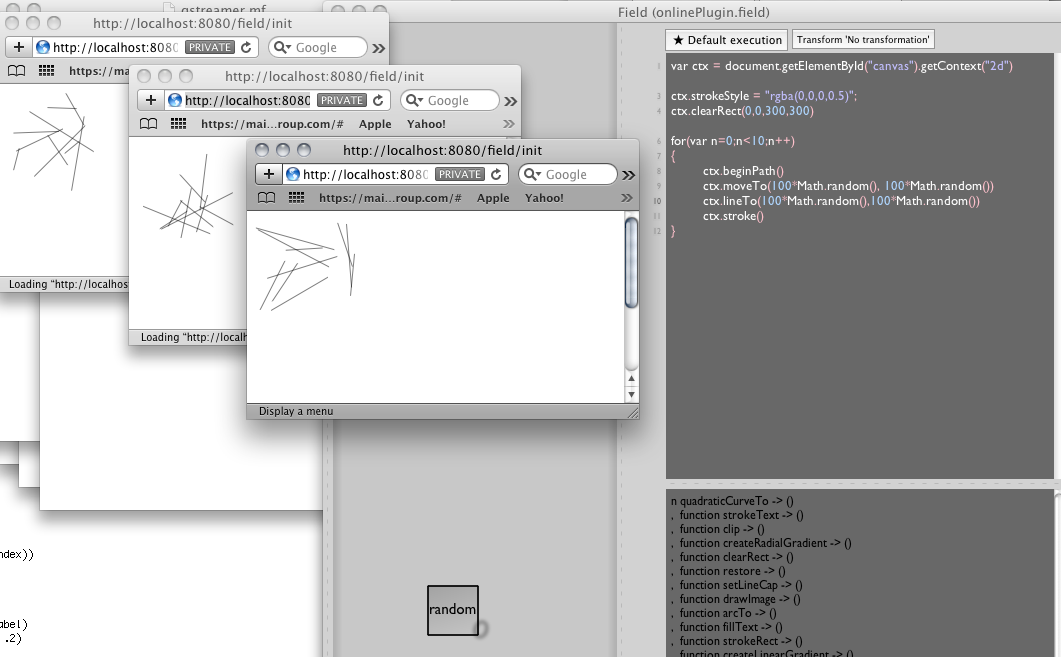
Yields 3 different random pictures when opened in 3 different browser windows:
Finally, let's take this all the way:
var ctx = document.getElementById("canvas").getContext("2d")


var tt = 0

ctx.clearRect(0,0,300,300);
ctx.fillStyle = "rgba(164,100,0,0.03)";
ctx.strokeStyle = "rgba(100,200,0,0.3)";

function t1()
{

    ctx.beginPath();
    ctx.arc(155+Math.cos(tt/120.0)*100, 135+Math.sin(tt/100.0)*100, 10, 0, Math.PI*2, true);
    ctx.closePath();
    ctx.fill();
    ctx.beginPath();
    ctx.moveTo(Math.cos(tt/30.0)*300, Math.sin(tt/300.0)*300)
    ctx.lineTo(Math.sin(tt/100.0)*300, Math.cos(tt/120.0)*300)
    ctx.stroke();

    tt+=1;

}

function clearStart()
{
    ctx.clearRect(0,0,300,300);
}


_r = [clearStart, t1, clearStart]
That _r should be very familiar to Field users (if not, see here). We're declaring that the function t1 should be injected into our animation loop. Upon "start" (say, page-up on this box) we should clearStart() then t1() every frame of animation. Finally, upon "stop" we should clearStart() again.
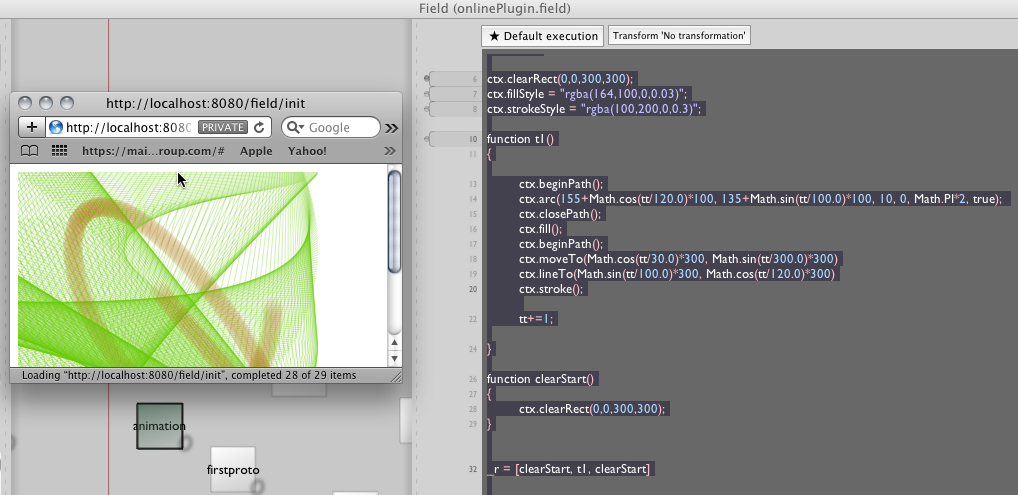
As you might expect, while this animation is running, everything else is still operating asynchronously. You can send additional pieces of code to the web-browsers (for example, you can stab out ctx.clearRect(0,0,300,300) to clear everything that's been drawn so far, or tweak the .strokeStyle a little while the drawing is taking place. You can even start and stop other animating boxes independently.
For the person, like me, who is not an expert in HTML 5 canvas drawing, having the combination of completion and incremental, piecemeal execution makes learning much, much faster and more direct than reading documentation and trying out complete programs repeatedly with the "reload" button. We've ported one of the central arguments of Field into the online, Javascript world.
Processing.js
Field can wrap Processing, can Field/Javascript wrap Processing.js — the javascript "port" of Processing? It certainly can.
First let's change our server.init page to include the Processing.js source code:
server.init = """
<html>
<head>

<script language="javascript" src="/field/element/processing.js/javascript_v"></script>

<script language="javascript">
"""+_self.javascript_v+"""
</script>
</head>
<body>
<canvas id="canvas" width="300" height="300"></canvas>
<div id="protovisDiv"></div>

</body>
"""
Here we've "src"'d a url that might look a bit odd — effectively "http://localhost:8080/field/element/processing.js/javascript_v". Field's web-server connects all of the boxes in the current sheet into the "/field/element" namespace. So "field/element/processing.js" refers to the box with the name "processing.js". "field/element/processing.js/javascript_v" refers to the property javascript_v in this box. In that box/property we've copy and pasted the processing.js script (available from http://processingjs.org/download).
Now we're basically done. We can write (source code from the Processing.js online examples):
function sketchProc(processing) {
  // Override draw function, by default it will be called 60 times per second
  processing.draw = function() {
    // determine center and max clock arm length
    var centerX = processing.width / 2, centerY = processing.height / 2;
    var maxArmLength = Math.min(centerX, centerY);

    function drawArm(position, lengthScale, weight) {
      processing.strokeWeight(weight);
      processing.line(centerX, centerY,
        centerX + Math.sin(position * 2 * Math.PI) * lengthScale * maxArmLength,
        centerY - Math.cos(position * 2 * Math.PI) * lengthScale * maxArmLength);
    }

    // erase background
    processing.background(200)

    var now = new Date();

    // Moving hours arm by small increments
    var hoursPosition = (now.getHours() % 12 + now.getMinutes() / 60) / 12.2;
    drawArm(hoursPosition, 0.5, 5);

    // Moving minutes arm by small increments
    var minutesPosition = (now.getMinutes() + now.getSeconds() / 60) / 6;
    drawArm(minutesPosition, 0.80, 3);

    // Moving hour arm by second increments
    var secondsPosition = now.getSeconds() / 60;
    drawArm(secondsPosition, 0.90, 1);
  };
}


var canvas = document.getElementById("canvas")

var processingInstance = new Processing(canvas, sketchProc)

function nothing() { }

function stopProcessing()
{
    processingInstance.exit()
}

_r = [nothing, nothing, stopProcessing]
There are some gymnastics involved here about calling "processingInstance.exit()" when the box "stops" — Processing "javascript sketches" take control of their own update cycle internally. But other than that, we find ourselves now, in a radically different runtime, library, medium in the same spot as in Field/Processing — dynamic, iterative, experimental, and free of the reload button. Processing.js "applets" compose on the fly, and global variables can be used to hack values into running animations.
To get a sense of the power of this, try lifting the drawArm function, currently embedded inside sketchProc into the global namespace. Then you can tweak its definition while the rest of the sketch is still running.
Protovis
One last example, that follows straight along from the Processing.js example — [[Protovis]. This library is a very interesting platform for data visualization. Again, we need a little more <script> in our server.init page:
server.init = """
<html>
<head>
<script language="javascript" src="/field/element/protovis/javascript_v"></script>
<script language="javascript" src="http://vis.stanford.edu/protovis/ex/miserables.js"></script>
<script language="javascript">
"""+_self.javascript_v+"""
</script>
</head>
<body>
<div id="protovisDiv"></div>

</body>
"""
We've included the protovis main class directly inside the Field sheet just like we did with Processing.js above. This time around we've lost the <canvas> tag and replaced it with a plain old placeholder <div>. That's where Protovis is going to be putting it's (SVG-based) output.
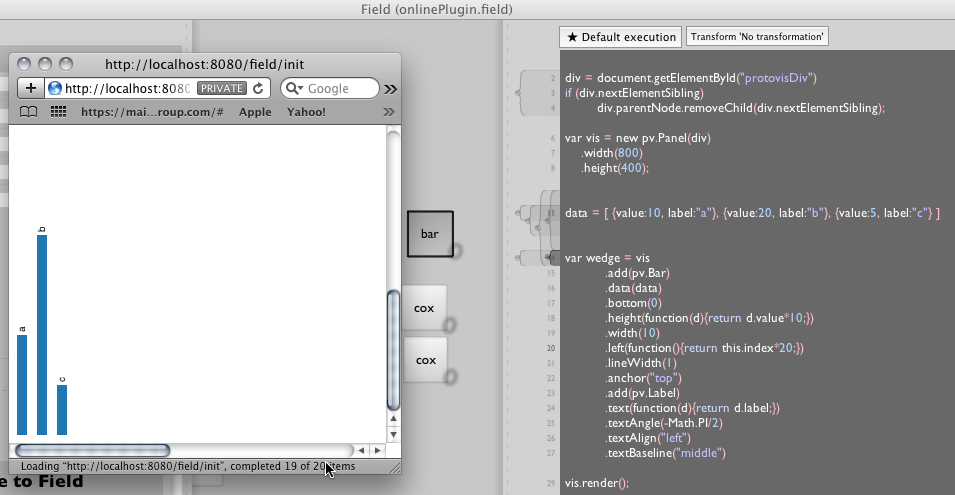
Now we can plot data:
div = document.getElementById("protovisDiv")
// this makes this code idempotent
if (div.nextElementSibling)
    div.parentNode.removeChild(div.nextElementSibling);

var vis = new pv.Panel(div)
    .width(800)
    .height(400);


data = [ {value:10, label:"a"}, {value:20, label:"b"}, {value:5, label:"c"} ]


var wedge = vis
          .add(pv.Bar)
          .data(data)
          .bottom(0)
          .height(function(d){return d.value*10;})
      .width(10)
      .left(function(){return this.index*20;})
          .lineWidth(1)
      .anchor("top")
      .add(pv.Label)
      .text(function(d){return d.label;})
      .textAngle(-Math.PI/2)
      .textAlign("left")
      .textBaseline("middle")

vis.render();
Yields:
Sending data
One final example that ties these things together. Let's plot a bar chart of the populations of the states of the US.
First, in Field / Python (and Java) let's query a database. Using Jena we can launch a Sparql query against the curated RDF database of government data held by the Tetherless World group at RPI. Here's the code:
from com.hp.hpl.jena.sparql.resultset import JSONOutput
from com.hp.hpl.jena.query import *

qe = QueryExecutionFactory.sparqlService("http://logd.tw.rpi.edu/sparql", """

SELECT distinct ?state_abbv ?agi ?population
WHERE {
 GRAPH  <http://logd.tw.rpi.edu/source/data-gov/dataset/353/version/1st-anniversary>{

   ?s1  <http://logd.tw.rpi.edu/source/data-gov/dataset/353/vocab/raw/popu_st> ?population.
   ?s1  <http://logd.tw.rpi.edu/source/data-gov/dataset/353/vocab/raw/pub_fips> ?state_fipscode .
 }
 GRAPH <http://logd.tw.rpi.edu/source/data-gov/dataset/1356/version/2009-Dec-03> {
   ?s2 <http://logd.tw.rpi.edu/source/data-gov/dataset/1356/vocab/raw/state_abbrv> ?state_abbv .
   ?s2 <http://logd.tw.rpi.edu/source/data-gov/dataset/1356/vocab/raw/county_code> "000" .
   ?s2 <http://logd.tw.rpi.edu/source/data-gov/dataset/1356/vocab/raw/agi> ?agi.
   ?s2 <http://logd.tw.rpi.edu/source/data-gov/dataset/1356/vocab/raw/state_code> ?state_fipscode .
 }
}
order by ?state_fipscode

""")

rr = qe.execSelect()
json = JSONOutput().asString(rr)
That embedded Sparql query mashes up two government sourced data-sets to provide a unifed set of States, populations and agricultural output (bound to ?agi in this case). Since we're still learning Sparql as a language we can just sit with Field and iterate on the query string, and introspect the return value to see exactly what we're getting back from the database.
Once we're done, perhaps after massaging the data a little bit in Python, we can broadcast it to all web-browsers who are listening:
_self.online.setVariable("theData", json)
Now we can go back to Javascript to work on our visualization (the query, and the transmission of the query results are done exactly once while we iterate on our visualization). First we hack our way very quickly towards:

Then after a few short minutes — knowing very little about this particular visualization library — constantly inspecting (command-/) and running (command-0) we end up with:
div = document.getElementById("protovisDiv")
if (div.nextElementSibling)
    div.parentNode.removeChild(div.nextElementSibling);

var vis = new pv.Panel(div)
    .width(800)
    .height(400);

data = theData.results.bindings


var wedge = vis
          .add(pv.Dot)
          .data(data)
          .left(function(d){return (-13+Math.log(d.population.value))*144.0;})
      .bottom(function(d){return (-16+Math.log(d.agi.value))*84.0;})
      .size(10)
      .add(pv.Label)
      .text(function(d){return d.state_abbv.value;})
      .textAlign("left")
      .textBaseline("right")

vis.render();
A scatter-plot (with logarithmic axes) of population vs agricultural production.
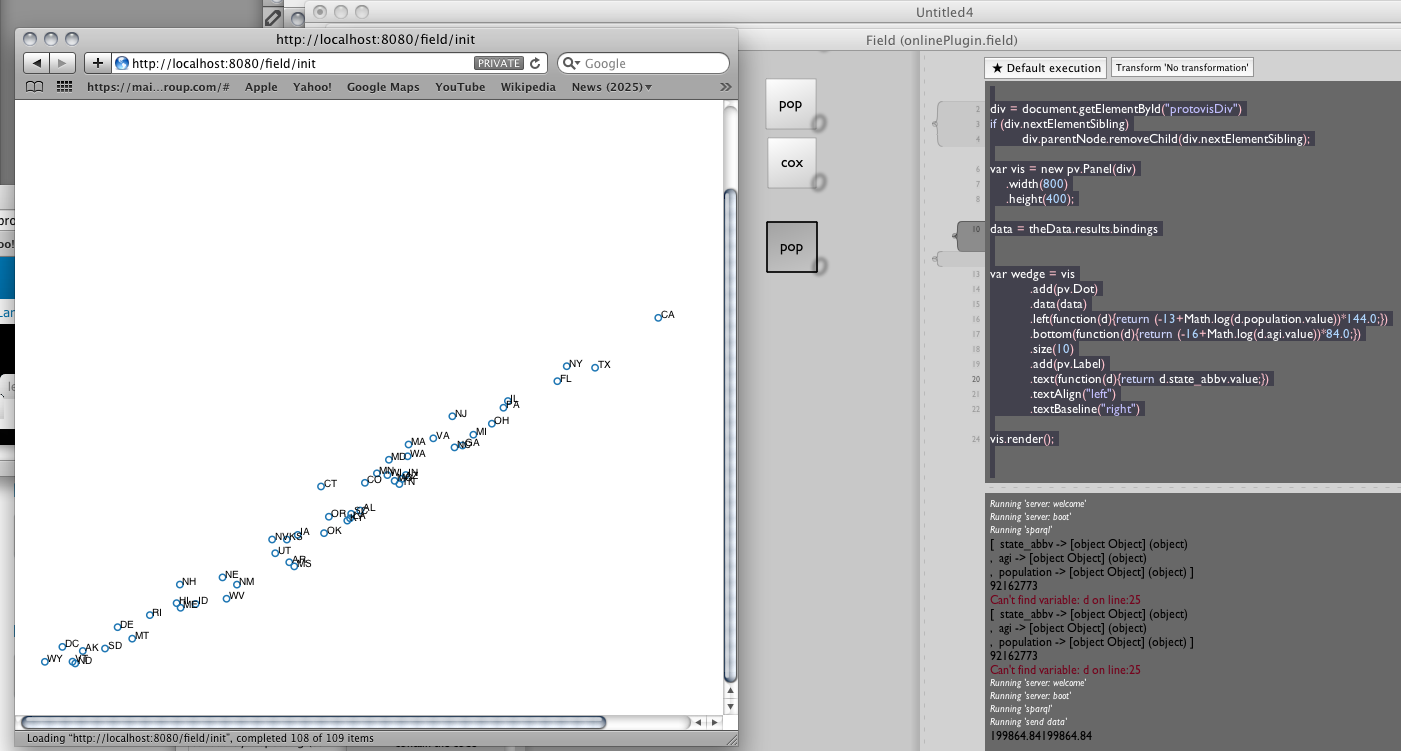
(click to enlarge). A masterpiece of online visualization? Hardly, but one that took only a few minutes of work while tying together unfamiliar frameworks (in a largely unfamiliar language).
Status
The Online Plugin is just getting started and already we can think of uses for it. Obviously we hope that it will be of interest to Javascript hackers everywhere, and it may even make Javascript hackers out of us.
Things that we'd like to add, and soon:
- Export the journal. We ought to be able to take the complete Javascript execution journal and dump it out to a single file — ripe for inserting into a static webpage.
- Return data. Browsers should be able to return data to Field. This is already actually happening (it's how completion and printing works) but it needs to be implemented correctly for it to be useful. Already web-browser clients are identified by a unique ID. Data sent back needs to be represented in Field as a map of bowser id against this data rather than as a single value — after all, it's possible for all of the browsers to have their own different data.
- Broadcast support. Currently animation start and stop works — this means that you can create Javascript "broadcasts" by placing Javascript objects in a timeline and scrubbing them. But web-browsers that join late currently catch up as quick as they can — ignoring the timing information of execution. Perhaps we can add this information back into the journal.
- Websockets. We have a version of the web-serving templates that use WebSockets. This is fantastic for sending large amounts of binary data to browsers. We need to document this.