Drawing Lines 2 — Properties
This reference page follows on from DrawingFLines which explains the basics of generating splines in Field and filtering & transforming their contents to create new material.
If you want to know how to draw a rectangle, then DrawingFLines is the page you are looking for; if you want to know how to fill it in with red, then this is the correct page.
Properties in the abstract
You can set any property you like on lines at any time:
line = FLine()
line.name = "banana"
print line.name # prints banana

line.moveTo(40,40).thisVertexIsSpecial_v = 1
line.lineTo(100,100)
line.thisLineIsntSpecial = 1
Properties can be associated with lines or with any particular vertices on a line. Vertex properties end, by convention, with _v. If you set a _v property on a FLine you are setting it on the vertex that you just wrote, therefore you should set these as you go.
Because setting properties is so important to FLine's, we dedicate a piece of Python's syntax to them. You can 'call' FLines with lists of properties to tag:
myLine.moveTo(50,50).lineTo(100,100).cubicTo(100,50, 50, 100, 150, 150)
myLine(color=Vector4(1,1,1,0.2), filled=1, derived=1, thickness=5)
_self.lines.add(myLine.copy()(color=Vector4(0,0,0,0.5, thickness=2))
Sometimes this is all you need — by tagging lines and vertices with labels and data you can then pass bundles of them around, and let other piece of code act on this data. For example, this finds all the lines with "name" associated with them
[x for x in _self.lines if x.name]
Standard Properties
Some properties have special meaning when they enter the actual line drawing system.
Class of geometry
Firstly, are the shape's outline, file, and points shown?
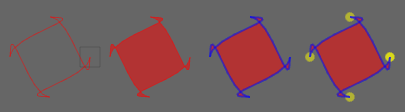
stroked— whether the line is outlined (0 or 1)filled— whether the line is filled (0 or 1)pointed— whether the line has little squares at each vertex (0 or 1)
Using combinations of these we can make things like:
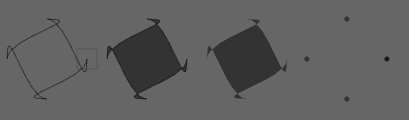
From left to right we have (1) stroked#1 (the default); (2) filled1, (3) stoked#0, filled1; and (4) stroked#0, pointed1.
Thicknesses of geometry
thickness— how thick the line is is in pixels. This is a very rough, but fast "OpenGL" kind of thickness.strokeType— a (Java) BasicStroke object that will be used to stroke this line before sending it to the renderer. This is a very professional, but slower kind of thickness (which also works for dashes and dots; with correctly rendered end-caps and mitred corners, &c). For example:
line.strokeType=BasicStroke(5, 1, 1, 1, (10,10),0)
gives you a dashed line 5 units thick. Check the documentation for BasicStroke.
Using combinations of these we can make things like:
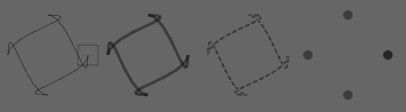
From left to right we have (1) the default line; (2) thickness#3; (3) strokeTypeBasicStroke(2, 1, 1, 1, (4,3), 0); and (4) pointed#1, pointSize10.
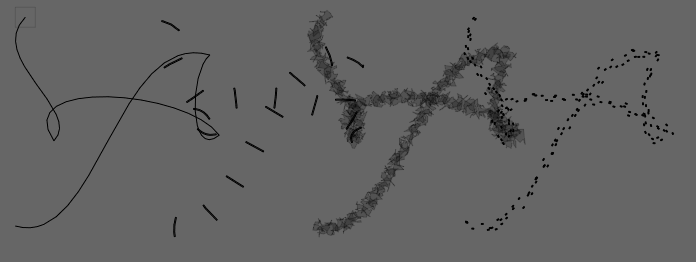
strokeType 'strokes' the line — computes the thickness, end-caps and dashes — just before it ends up on the screen. Sometimes you want to stroke the line and then manipulate those dashes thickened geometry as individual FLine:
def randomLine():
    myLine = FLine()
    myLine.moveTo(75+Math.random()*20,75+Math.random()*20)
    for n in range(0, 4):
    #   myLine.polarCubicTo(1,3, 1, 3+Math.random(), 50+Math.random()*450,50+Math.random()*450)
        myLine.polarCubicTo(1,3*Math.random()-1.5, 1, 1, 50+Math.random()*250,50+Math.random()*250)
    #   if (Math.random()<0.8):
    #       myLine.lineTo( * (Vector2().noise(50)))

    myLine+=Vector2(500,-600)
    myLine+=Vector2(20,0)
    _self.lines.add(myLine)
    return myLine

r1 = randomLine()
dashed = r1.copy().strokeWith(thickness=1,  dash=(20,20))(derived=1)
dashed+=Vector2(150,0)
segmented = dashed.segment()
for n in segmented:
    n+= rotation(Math.PI/2)
    _self.lines.add(n)

dashed = r1.copy().strokeWith(thickness=10, join=1, dash=(1,5))(derived=1, filled=1, color=Color4(0,0,0,0.2))
dashed+=Vector2(300,0)
segmented = dashed.segment()
for n in segmented:
    n.visitPositions(lambda x,y : Vector2(x,y).noise(10))
    _self.lines.add(n)

dashed = r1.copy().strokeWith(thickness=1,  dash=(2,2))(derived=1, filled=1)
dashed+=Vector2(450,0)
segmented = dashed.segment()
for n in segmented:
    n+= Vector2().noise(10)
    _self.lines.add(n)
This produces geometry like these:
pointSize_v— We can very the the size of the point on a per-vertex basis.
For example:
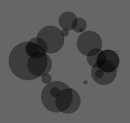
can be generated from code like:
myLine.resample(20)
myLine(derived=1, color=Color4(0,0,0,0.4), pointed=1, stroked=0)
_self.lines.add(myLine)
for n in myLine.nodes:
    n.pointSize_v = 40*Math.random()
Colors
color,strokeColor,fillColor,pointColor— can all be set toColor4objects that to give the colors of strokes, fills and points. IfstrokeColor, for example, isn't set, and theFLinehas a visible stroke, it will take its color fromcolor. If that isn't set, then the stroke will appear black.Color4is really just aVector4containing 'red', 'green', 'blue' and 'alpha' for the color.
For example:
From left to right, lines with properties
line1(color=Color4(1,0,0,0.5))
line2(color=Color4(1,0,0,0.5), filled=1)
line3(color=Color4(1,0,0,0.5), strokeColor=Color4(0,0,1,0.5), thickness=2, filled=1)
line4(color=Color4(1,0,0,0.5), strokeColor=Color4(0,0,1,0.5), thickness=2, filled=1, pointed=1, pointSize=10, pointColor=Color4(1,1,0, 0.5))
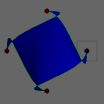
strokeColor_v,fillColor_v,pointColor_vandpointSize_vsupply per-vertex colors. While the per-vertex fill color is a little dependent on whatever comes out of Field's tessellator, for simple or regular geometry it can be used well. (Note: there is nocolor_v).
Thus:
myLine(filled=1, pointed=1)
for n in myLine.nodes:
    n.pointColor_v = Color4(Math.random(),0,0,1)
    n.fillColor_v= Color4(0, 0, Math.random(), 1)
    n.strokeColor_v = Color4(0, Math.random(), 0, 1)
Produces:
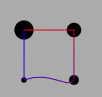
Finally, we note that vertex properties that are Vectors, or floating point numbers (but not integers) are interpolated across vertices where needed:
p = FLine().moveTo(50,50)
p(strokeColor_v = Color4(1,0,0,1), pointSize_v=20.0)
p.lineTo(100,50)
p.lineTo(100,100)
p.relCubicTo(10,10,10,-10,50,100)
p.lineTo(50,50)
p(pointSize_v=1.0, strokeColor_v=Color4(0,0,1,1))
p.pointed=1
Produces:
For people coming from drawing models (PDF, NSBezierPath, NodeBox, java.awt.geom) that are similar to Field, per-vertex interpolated properties are ultimately the main difference (Field has to go to some lengths to ensure that you can export such lines to PDF).
Animation .forceNew
Field likes to aggressively cache lines once they have been drawn once --- indeed, FLine instances are treated as immutable after they have been drawn once. But a new object in Field 14 the FLine is mutable and offers all of the functionality of the old FLine. To force Field to re-tesselate and upload geometry to the graphics card again set .forceNew=1 on a line:
x = FLine().moveTo(400, 400).lineTo(400,800)
_self.lines.clear()
_self.lines.add(x)

def animator():
    global x
    x += CFrame(r=0.1, center=Vector2(400,600))
    x.forceNew = 1
    _self.dirty=1

_r = animator
Adding Text
Two properties are needed to add a label to a node:
* firstly, you need to set containsText to warn the renderer that this line contains text.
* then you specify the text you want by setting text_v. Starting the string with "<html>" lets you use HTML formatting codes (like <b> and <i>) and even <font>).
* optionally font_v to be the (Java) Font you'd like.
* and alignment_v to be the (Java) the kind of justification you'd like (1 — left; 0 — centered; and -1 — right).
So something like:
p = FLine()(containsText=1)
p.moveTo(100,100).text_v = "hello"
p.moveTo(120,120).text_v = "world"
p.font_v = Font("Impact", 0, 50)
(you might have to import java.awt.Font, by executing from java.awt import Font). This yields:

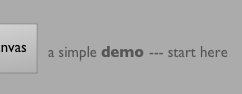
You can also have multi-line (wrapping) text by using containsMultilineText rather than containsText
label= """a simple <b>demo</b> --- start here"""
width=300
opacity=0.5

#---------------------------------------------

from java.awt import Font
_self.lines.clear()

text = FLine().moveTo(0,0)(offsetFromSource=Vector2())

text(containsMultilineText=1)
text(multilineWidth_v=width)
text(text_v=label)

text(font_v=Font("Gill Sans", 0, 15))
text(totalOpacity=opacity)

_self.lines.add(text)
Yields:
These kinds of text suffices for simple labeling of points for the purposes of drawing UI, plotting graphs and so on. To do anything sophisticated with text you need to actually convert it into FLines. The helper class here is AdvancedTextToCachedLine:
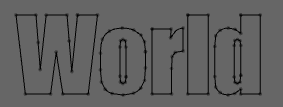
impact = AdvancedTextToCachedLine("Impact", 100)
myText = FLine(impact.getLine("World", 120, 120))
Gives you the actual outlines:
This is now just a FLine so you can add attributes to it:
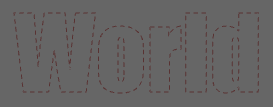
In this case strokeType#BasicStroke(1,1,1,1,(4,4),0), derived1, color=Color4(0.3,0,0,0.5)
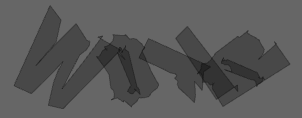
or:
for n in myText.segment():
    n += rotation(Math.random()*4)
    n.visitPositions(lambda x, y : Vector2(x,y).noise(10))
    n(filled=1, color=Color4(0,0,0,0.3), derived=1)
    _self.lines.add(n)
to give:
Adding Image labels
Just as you can add text to points, you can also add images. So for a containsText and text_v pair of global and local properties, there are containsImage and image_v properties.
CoreGraphicsExtensions has a tutorial on the wrapper around FLine that turns Field into an hybrid vector / GPU accelerated image processing environment. But the short idea is that:
from CoreGraphics import *
line = FLine().moveTo(40,40)
line.containsImages = 1
line.image_v = image("/Developer/Examples/OpenGL/Cocoa/GLSLShowpiece/Textures/Abstract.jpg")
gives you:
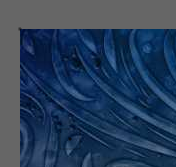
This 'label' is an image (connected to Apples CoreImage framework) that's 'attached' to a point (and thus can be moved around with the spline editor). There's a host of methods for sourcing and manipulating images discussed in CoreGraphicsExtensions.
Adding Web-pages
A special kind of image that you can add is a (fully interactive) web-page. See here.
Preventing & Adding Interaction
derived— setting this to1does two things. Firstly it prevents the line from being selectable, and it prevents the line's nodes from being manipulatable by the drawing editor (see BasicDrawing for an overview). Secondly, the nodes are no longer decorated by dots when this element is selected. Sometimes those dots can overwhelm the thing that you are actually drawing.
This is useful for visual reasons, but also, with the default spline manipulation tools out of the way, you can add your own ways of interacting with lines. Using eventHandler you can make FLines respond to mouse events by setting properties on the lines that contain Python functions. See LineBasedInteraction for a tutorial.
Relative drawing & Notation
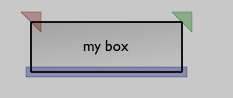
Usually drawing takes place in the coordinate system of the screen (or the camera if you are drawing into a 3d canvas). Sometimes, it's useful to draw into the coordinate system of your code-box. This lets you make badges and notations for your elements. For example:
Mixins().mixInOverride(SplineComputingOverride, _self)
_self.lines.clear()

x = FLine(filled=1, color=Color4(0.4,0,0,0.3)).moveTo(-10,-10).lineTo(10,-10).lineTo(10,10).lineTo(-10,-10)
x(offsetFromSource=Vector2(0,0))
_self.lines.add(x)

x = FLine(filled=1, color=Color4(0,0.4,0,0.3)).moveTo(-10,-10).lineTo(10,-10).lineTo(10,10).lineTo(-10,-10)
x(offsetFromSource=Vector2(1,0))
_self.lines.add(x)

x = FLine(filled=1, color=Color4(0,0,0.4,0.3))
x.moveTo(-5, -5)(offsetFromSource_v=Vector2(0,1))
x.lineTo(5, -5)(offsetFromSource_v=Vector2(1,1))
x.lineTo(5, 5)(offsetFromSource_v=Vector2(1,1))
x.lineTo(-5, 5)(offsetFromSource_v=Vector2(0,1))
x.lineTo(-5, -5)(offsetFromSource_v=Vector2(0,1))
x(offsetFromSource=Vector2())
_self.lines.add(x)
- '''
offsetFromSource=Vector2(x,y)''' — tells Field that this line is specified with respect to the box it's drawn in, not the canvas.=0, y=0is the top-left hand corner of the boxx=1,y=0the top-right and so on (x=-1would be a value one width outside of the box). - '''
offsetFromSource_v=Vector2(x,y)''' — tells Field that this ''vertex'' is specified with respect to the box it's drawn in, not the canvas. Note this property only has an effect on a line that hasoffsetFromSourceset on it (otherwise Field would have to scan all nodes of all lines for this property every frame — very time consuming).
In the example above we use these two properties to draw two badges that remain fixed to the corners of the box no matter where we drag the box and a blue area at the bottom that tracks both the position and the size of the box. See AdHocUi for more ideas along these lines.
Properties for PDF export
Field can export PDF's of FLine based geometry. A very few properties are PDF specific (that is, Field's OpenGL-based renderer can't show them and will simply ignore them):
- '''
notForExport''' — don't export this to PDF (you can tag 'debugging' lines and UI things with this safe in the knowledge that they won't end up in your print. You can toggle these things on and off in the canvas by pressing f2. - '''
outputOpacityType''' — set to a string to indicate the kind of PDF6 transparency you want: for example "Saturation" or "Multiply". - '''
noTransform''' —Lineis specified in absolute coordinates and is not scaled onto the page (this is very rare that you want to do this).