Basic Drawing Plugin
The basic drawing plugin allows you to draw directly onto the canvas using code, or in some cases, using the mouse. This is a very simple set of drawing primitives, but it allows you to do quite powerful things. Firstly, you can use it as the basis for notation systems in the canvas; secondly, you can use it to make user interface things (for example, you can make links and graphs); thirdly you can make art with it directly (OpenEnded's piece Breath was done almost entirely this way — Field exports PDFs and SVGs); and finally, you can use the FLine system to draw into other windows, windows not cluttered up with Field things — see BaseGraphicsSystem.
The video to the right here gives a brief taste of Field's drawing system.
The drawing primitives should be familiar to anybody who has done anything with the Postscript drawing model (as recapitulated in, say, NSBezierPath in Cocoa or Graphics2D / GeneralPath in Java). Like many of these systems, Field's system is aggressively optimized for drawing the same thing over and over again — that is, drawing a new complicated line with many curves is relatively expensive, but drawing the very same line, again, isn't.
Tutorial
The FLine drawing system is covered in this downloadable tutorial. (A more comprehensive reference may be found in the DrawingFLines page.)
Getting ready to draw lines
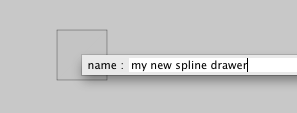
Firstly, we'll need a box to draw in. As you probably know, in Field code goes in Boxes. While you can draw from anywhere, there's a special kind of box with a minimal appearence that doesn't get in the way of what it is you want to display. You can make a new "Spline drawer" by tapping "p" in the canvas or selecting the appropriate menu item from the right click menu.
With that box made we can now make some lines:
_self.lines.clear()

line = FLine().moveTo(10,10).lineTo(50,50)
line.color = Vector4(1,0,0,0.5)

_self.lines.add(line)
This draws a diagonal (top-left towards the bottom right) line, in red, at 50% opacity. FLines support the simple set of drawing operations — moveTo(x,y), lineTo(x,y), cubicTo(c1x, c1y, c2x, c2y, x,y) and close() all move the drawing point to a position (with the "pen" raised), draw a line to a point, draw a curve to a point using two other points as control positions and finally return to the most recent "moveTo" position.
So far, so conventional. But, you'll notice a few things about the code above. Firstly, this code is steady-state. That is, it's safe to execute this over and over again and you end up with the same thing. Steady-state code is often how you want to write things in Field, and even more often how you want to draw things. In its simplest usage, you keep tweaking, say, that color while jabbing command-0 to execute the whole block over and over until you have the line just the right color — see TextEditor.
Without the call to _self.lines.clear() at the start, each time that this code is executed, you'll end up with an additional line, which is almost certainly not what you want. There are additional, fancier ways of helping write such code, but for now, a simple call to _self.lines.clear() at the start will do.
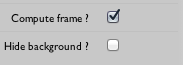
Secondly, and especially if you "Mixed-in" spline drawing assistance, you'll notice that the frame of the visual element has changed. It's now at the start of the line. By default this kind of box sets the frame of the visual element to be a border around the first point of the first line. This provides a roughly stable spot that helps with selecting these chameleon-like elements: You can click to select the element by either clicking on the actual geometry of the element, or in this small rectangle. You can disable this behavior in the inspector.
Drawing and Editing
That's enough preparation, onto some serious algorithmic line drawing. Obviously, there's more to FLine than this:
_self.lines.clear()

for n in floatRange(5, 30, 5):
    line = FLine().rect(0,0,30,20)

    line += CFrame(s=(1+Math.pow(n, 0.5), 1+n/2))
    line += CFrame(t=(n*10, 0))
    line += CFrame(r=0.03*n)

    line.color = Vector4(1,n/30.0,0,0.25)

    line.filled =1
    line.fillColor = line.color/2

    _self.lines.add(line)
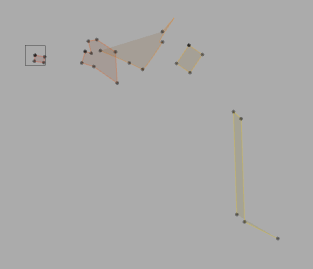
Gets us a visual element that draws itself like this:
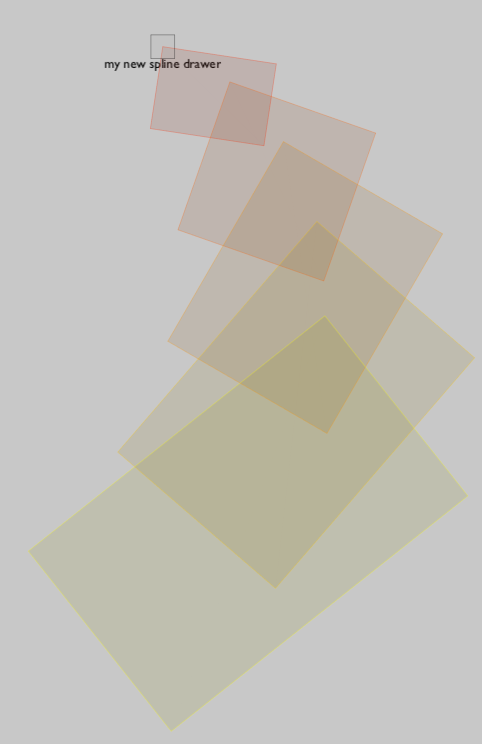
Line by line it should be fairly clear what's going on. Each line starts off as a rectangle, which is the scaled (non-uniformly), translated & rotated. It's then given a color, filled and then it's fill color (which would have defaulted to being the same the stroke color) is set to be darker and more transparent.
An unexpected turn
Now you might notice more things about this drawing system. Firstly, should you restart Field at this point, your drawing is intact without any code being executed. FLines persist on disk (and they are compressed as well, so you can have quite a bit of geometry in a file).
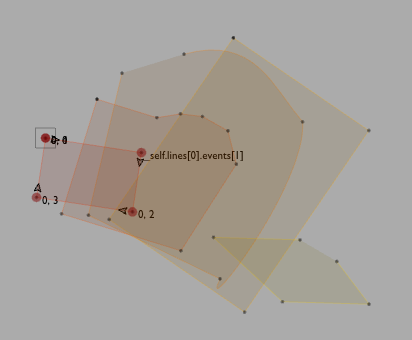
Secondly, and much more intriguingly, when you have the element selected, you have some dots at the vertices of your rectangles.
You might even notice that you can click on them and drag them around like you were in Adobe Illustrator, but when you release the mouse, it snaps back to where it was before.
What is going on here? To eliminate this snapping-back behavior, add this line to the end of the python code:
_self.tweaks()
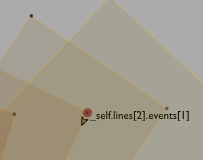
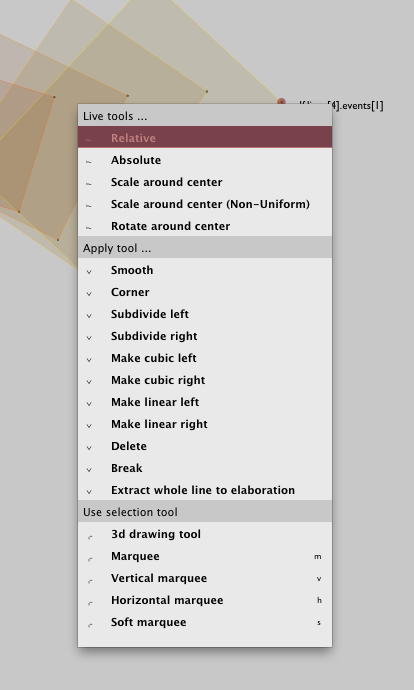
Now you can edit the rectangles with the mouse. Try shift-right-clicking on a node and a fairly powerful node-based drawing tool will reveal itself to you:
But what does _self.tweaks() do? While you are mousing around (specifically, when you release the mouse) you are actually appending code to the property tweak_v which _self.tweaks() executes. This code is the code that takes the contents of _self.lines and modifies it to reflect all of the operations you've done with the mouse. Think of this as a code-based history, which you can edit, comment, and so forth. When you complete an edit, your code box is executed, and via (_self.tweaks()) your edit is also executed.
Clearly, I'm not a great hand-illustrator, but note the addition of extra nodes, a spline segment and so on.
So now we have something truly odd — we can write code that makes lines, and we can edit them with a mouse, which also writes code (that edits lines). What happens if we edit the original code?
It depends very much on the edit. But if you change your original script, your mouse-based changes get reapplied. Here we change the size of the original rectangles, in the script — what was Rect(500,500,30,20) is now Rect(500,500,3, 2):
Obviously, it's possible to change the main code in such a way as to make reapplying the mouse operations impossible, or at the very least ambiguous. But changing, say, the color of a line will work just fine and other operations (like translating, scaling, and so forth) will work depending on which tool you've used to actually apply the change. Note: If you want to apply changes after the mouse operations, you can dig lines back out of _self.lines and modify them further.
By recasting UI interaction problems as line-editing problems, you can exploit this editor as a more general UI device (you could make a keyframe graph curve editor, for example). In ColorMatchingTutorial we build the UI for a primitive, but unique color matching "system". Should you want a more traditional, and home-made set of callbacks (mouse-down, up, drag etc.) over shapes described by lines, see: LineBasedInteraction.
Finally, should you not want lines to be editable at all, just set line.derived=1 on them and they wont be selectable. You'll want to do this for any line that you computed based on other lines (edited) state.
Some line properties of note
Throughout the example code above we've been setting properties on lines — these are accessed just as attributes in Python on the line itself. You can write any kind of property you like, including ones that you just make up on the spot:
line = FLine()
line.name = "banana"
print line.name # prints banana
But some properties have special meaning when they enter the actual line drawing system. We've already seen some above color — a Color4 (r,g,b,alpha) of the line; and filled — 0 or 1 depending on whether this line is "filled" or not. The complete list of line properties is documented here , but here are some that you might want to be aware of:
Class of geometry
stroked— whether the line is outlined (0 or 1)filled— whether the line is filled (0 or 1)pointed— whether the line has little squares at each vertex (0 or 1)
Thicknesses of geometry
thickness— how thick the line is is in pixels. This is a very rough, but fast "OpenGL" kind of thickness.strokeType— a (Java) BasicStroke object that will be used to stroke this line before sending it to the renderer. This is a very professional, but slower kind of thickness (and also dash &c). For example:
line.strokeType=BasicStroke(5, 1, 1, 1, (10,10),0)
gives you a dashed line 5 units thick. Check the documentation for BasicStroke. Finally, try the line.newLineByStroking(...) command, which actually gives you access to the new geometry for the line.
* pointSize — the size of those little points you get if you set pointed=1.
Colors of things
color,strokeColor,fillColor,pointColor—Vector4that change the color of things (thecolorproperty is the default for any of them.
Adding text
containsText— set to warn the renderer that this line contains text.- which is specified by setting
text_vto be the text you want, and optionallyfont_vto be the (Java) Font you'd like. Starting the string with"<html>"lets you use HTML formatting codes (like<font>and<b>).
text_v is our first "per-vertex" attribute: FLine() associates such attributes with the last vertex that you set. There's also:
Adding interaction
eventHandler— You can add interaction to line elements by giving them (event handlers)[LineBasedInteraction.html]. Here you can add callbacks when the mouse enters, exits, clicks down, releases and drags over the shape described by this line. See LineBasedInteraction for a little demonstration.
Per-Vertex things
color_v,strokeColor_v,fillColor_v,pointColor_vandpointSize_vwhich are per-vertex colors. While the per-vertex fill color is rather dependent on whatever comes out of the tessellator, for simple or regular geometry it can be used well.
And finally, rather than annotating points with text using text_v and containsText you can annotate them with images using image_v and containsImages. See CoreGraphicsExtensions.
Again, a complete list is available inside iLinearGraphicsContext for more advanced options. One final note: FLines are callable, and take keyword arguments, which allows for some very terse line drawing code:
myLine.moveTo(50,50).lineTo(100,100).cubicTo(100,50, 50, 100, 150, 150)
myLine(color=Vector4(1,1,1,0.2), filled=1, derived=1, thickness=5)
_self.lines.add(myLine.copy()(color=Vector4(0,0,0,0.5, thickness=2))