The statistics box
In case you didn't know, Field's "text" editor lets you embed graphical widgets directly in the source code. We've been trying to keep these widgets rather elemental — sliders, points, buttons, graphs and so on. That is: we've been trying to find widgets that are purpose neutral, and just help you "write" code for things where the "writing" part would be boring.
But there's one new widget that's a little more complex that we couldn't resist writing — The Embeddable Statistics Box.
Use case
What is it for? The stats box is a solution to a problem that, for us at least, keeps coming up. Either recognize this problem from the documentation below or you should probably skip this page completely.
We're in Field and we're writing code furiously:
# ... lots of complicated code above ...
listOfShapes = myComplicatedFunctionThatFindsShapes(someArguments)

# now we do something with this big list of things
for shape in listOfShapes:
    aLine = FLine().moveTo(shape.origin.x, shape.origin.y)
    aLine(color = Color4(0,0,0, # BANG
We have some complicated process that returns a "bunch of things" which we want to draw (or turn into musical notes, or colors, or network messages or in this case opacities).
What we're itching to write is some function of shape that returns a number between 0 and 1; some mapping between shape or shape.dimensions.w or I don't know what and the transparency of what we're going to draw.
The hands are on the keyboard, but we're not writing code — because we don't know what to write. What is in a "typical" shape? How big is it? Are they all 0 ? 1 ? 100 ?
This is a data visualization problem — and some people get payed to hack data visualization problems. Good for them: it's not the data visualization problem we wanted to work on today — we just want to get something on the screen.
Solution 1
What normally happens when confronted with this, is that I execute the first line listOfShapes = ... and then pop open a new visual element and start writing things like:
for shape in listOfShapes:
    print shape.dimensions.w
This just prints the quantity in question to the output box below the text editor. I'm certainly glad that I'm doing this in a "live" environment. Soon after I've done that I'm scrolling back through the text output to get a "feel" for the data. It's mostly near 0 but occasionally there's a 10 or a 20 - something. Complicated enough that I have to keep looking...
Oh hell, here we go again, I type:
max = 0
average = 0
for shape in listOfShapes:
   max = Math.max(max, shape.dimensions.w)
   average += shape.dimensions.w

average /= len(listOfShapes)
It's bad code (actually, it's not even correct code if shape.dimensions.w happens to be an integer), and by now I'm in a bad mood. I know that, if I really want to, I could start plotting graphs using FLine's but that's a lot of unanticipated work.
Eventually I get enough of a handle on the typical value that a shape.dimensions.w takes to go back to my original code and complete it:
listOfShapes = myComplicatedFunctionThatFindsShapes(someArguments)

# now we do something with this big list of things
for shape in listOfShapes:
    aLine = FLine().moveTo(shape.origin.x, shape.origin.y)
    aLine(color = Color4(0,0,0, Math.pow( Math.max(0, shape.dimensions.w-2.0)/24.0, 0.6)))
I might have to run the whole thing a few times to tweak the exponent; I might discover that myComplicatedFunctionThatFindsShapes sometimes returns a shape wider than 26.0 units and add another clamp. Isn't making art with computers fun?
Solution 2
The story above is long, tedious, brittle; it's hard to read and boring to write. What if myComplicatedFunctionThatFindsShapes changes? it is complicated after all. When I scan down this code a week later all I see is -2.0)/24.0, 0.6))) — what?.
Enter the stats box, A right click in the text editor gives you:
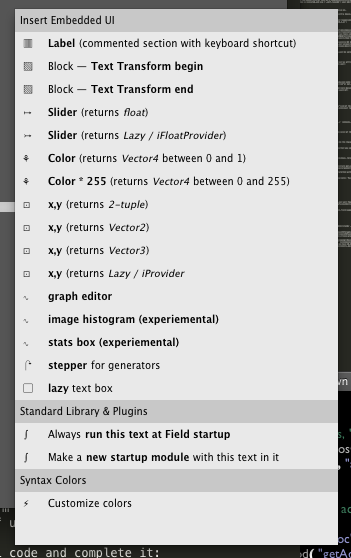
Which, when selected:
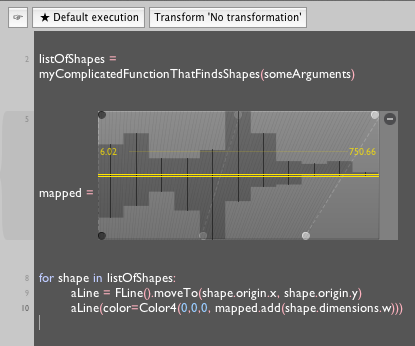
The stats box has an all important method — .add(f):
- Whenever you call
.addwith a number as an argument it adds this number to a histogram that tracks the distribution of these numbers - It maps this number through this distribution and returns a number that's between 0 and 1.
- It draws the distribution that it's currently modeling and gives you some handles to modify the mapping.
Left in its default state the stats box will collect all of the things that you .add in a single execution cycle (a single hit of option-click for example) and use that as it's modeling distribution for the next cycle.
myStatsBox.add(f) becomes the equivalent to:
(f-inputMin)/(inputMax-inputMin)
with inputMin and inputMax magically set correctly.
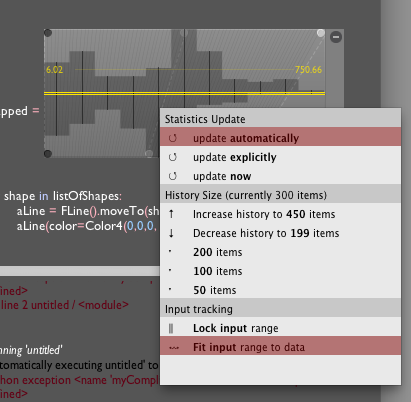
You can change when inputMin and inputMax get to change using the right click menu on the widget:
By default the histogram in the middle appears mirrored around the center line. This is showing you that (with the exception of the mapping from the domain inputMin -> inputMax onto the 0 -> 1 range ) the input distribution is left untouched.
Want to modify this mapping? Play with the black, grey and white boxes at the top and bottom of the histogram. If you've spent any time in Photoshop, what these things are doing will be very familiar:
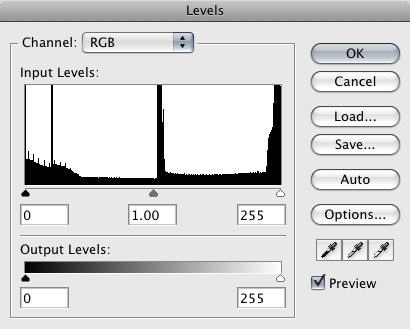
The top portion of the stats widget is like playing with top part of the Photoshop levels box, the bottom portion is like the "output levels" part (with an additional "gamma" control).
That's it. We'll be adding a little bit more text and descriptive stats to the appearance of the widget over the coming weeks — now that we've broken down and written the code, everything else will be pretty straightforward. We're also open to including different ways of doing the mapping — send us your suggestions.