
Sound
A few simple additions to Field allow for the creation of “visualizations” of sound. First, there’s now a version of a transport.control template that takes an audio file to play back. This template will keep the timeline synchronized to the playback of a sound.
Secondly, there’s support for loading pre-computed analysis files that contain a barrage of information about a particular sound file. This information can form the basis of your own work in sound-driven animation, or sound driven form. Of course, if you draw the analysis information “just right” then everything lines up: the transport control playback of the sound lines up with your drawing of the analysis information, and you have, in the Field worksheet, just the right tool for working with sound.
Loading and playback
Field makes a version of it’s a transport.control template available under the name transport.sound.control. Select ‘insert from workspace’ from the control-space command pallet:
That little box off to one side contains the code for loading a sound file. A fairly broad range of sound files are supported, but you can’t do anything too esoteric. If in doubt, you can convert a strange file to something more typical (a “16-bit 44100Hz mono .wav file” for example). Or, alternatively, send me a (pointer to) a sound sample, and I’ll convert it.
Once you are done editing the code that loads the sound file, remember to execute the whole box to actually load the file. From that point onwards you’ll get sound playing back when you run play (or press ctrl-p).
What time is it?
Crucially, we’ve now linked Field to an external clock — that means that Field’s red line will follow the audio playback hardware’s idea of what part of the sound is coming out of the speaker. This means that, for the first time, the horizontal position of a box has real absolute meaning. Field’s default is to say that there are 24 units of ‘x’ per second of time — that means that each ‘pixel’ (unless you zoom in) corresponds to a ‘frame’ at cinema speeds (24 frames a second). You can change this transformation inside ‘play’. You can also add a constant offset to tweak a delay between sound and image to compensate for any latency in the sound or display hardware that you have.
The upshot of this is that you’ll want the following conversions close to hand:
The ‘time’ in seconds corresponding to where the red line is will be _.time.frame.x/24. Less important is the opposite: the ‘place’ on the screen (in coordinates that Field uses) corresponding to a time in seconds is: x = time_in_seconds*24. You can use this for drawing on the worksheet that “line up” with the sample playback (see below).
Raw Sound
To have SoundAnalysis load files you need to process them first (to actually do the analysis). Send the (pointer to the) file to marcdownie@uchicago.edu and I’ll send you the analysis files back. Put the analysis files next to where the sound file is located
The first “analysis” of sound isn’t really an analysis at all: it’s merely access to the raw audio itself. Audio, for our purposes here, is a stream of numbers between -1 and 1, which essentially corresponds to pushing the diaphragm of a loudspeaker in and out. Typically you get around 44100 or 48000 of these numbers every second of time (any more than this and your ear can’t tell the difference, any less and you can begin to hear the lack of detail at the very highest pitches).
Let’s build an oscilloscope:
You’ll need to change this wav to be something that you have and something that’s been analyzed.
// load a sound that has been analyzed
var analysis = new SoundAnalysis("/Users/marc/Desktop/Portal2-OST-Volume1/Music/Portal2-19-Turret_Wife_Serenade.wav")

while(true)
{
    // get the samples at time _.time.frame.x/24 (where the red line is converted to 'seconds')
	var s = analysis.getRawSamples(_.time.frame.x/24)

    // s is a list of around 2000 things; s.length tells you how many

    // let's draw it
	var f = new FLine()

    // for every entry in 's' add it to 'f'
	for(var i=0;i<s.length;i++)
	{
        // scale it so that it fits into the 100x100 canvas
		f.lineTo(i/20, 50-s[i]*50)
	}

    // make it white so we can see it
	f.color = vec(1,1,1,1)

    // and draw it
	_.stage.lines.f = f

    // and wait for a frame
	_.stage.frame()
}
This gets you an oscilloscope:
Now you are looking at sound directly.
Analysis
As you might expect, the SoundAnalysis object can yield more subtle and complex “views” about the sound that it contains. In fact SoundAnalysis contains around 100 or so streams of information extracted from the audio. If you are feeling brave you can open up the actual analysis files in a text editor and stare at the numbers directly. Field exposes this information with a single kind of interface:
-
analysis.get("name_of_analysis", time_in_seconds)— gives a number from the analysis called “name_of_analysis” attime_in_seonds. Unlike the raw samples, each moment in time yields just a single number (all of these analyses take in chunks of audio in order to do their work). The units and ranges for these analysis vary widely depending on what analysis we are talking about, and what sound sample we are talking about. You might be better served with: -
analysis.getNormalized("name_of_analysis", time_in_seconds)— this scales everything so that the largest value that this will ever return is 1 and the smallest will be 0.
With these functions we can build a visualization to allow us to “audition” analyses:
// load the analysis
var analysis = new SoundAnalysis("/Users/marc/Desktop/Portal2-OST-Volume1/Music/Portal2-19-Turret_Wife_Serenade.wav")

// we're going to draw a line
var f = new FLine()

// we'll ask for the analysis at 100000 places, stretched from time 0 to the duration of the sound
for(var i of Anim.lineRange(0, analysis.duration,100000))
{
    // get the analysis scaled form 0 to 1
	var value = analysis.getNormalized("spectral_energy", i)

    // plot it, converting seconds to pixels so that it lines up with the red line
	f.lineTo(i*24, 100-100*value)
}

// actually see the line
_.lines.f =f
This gives us a little graph of the spectral_energy analysis:
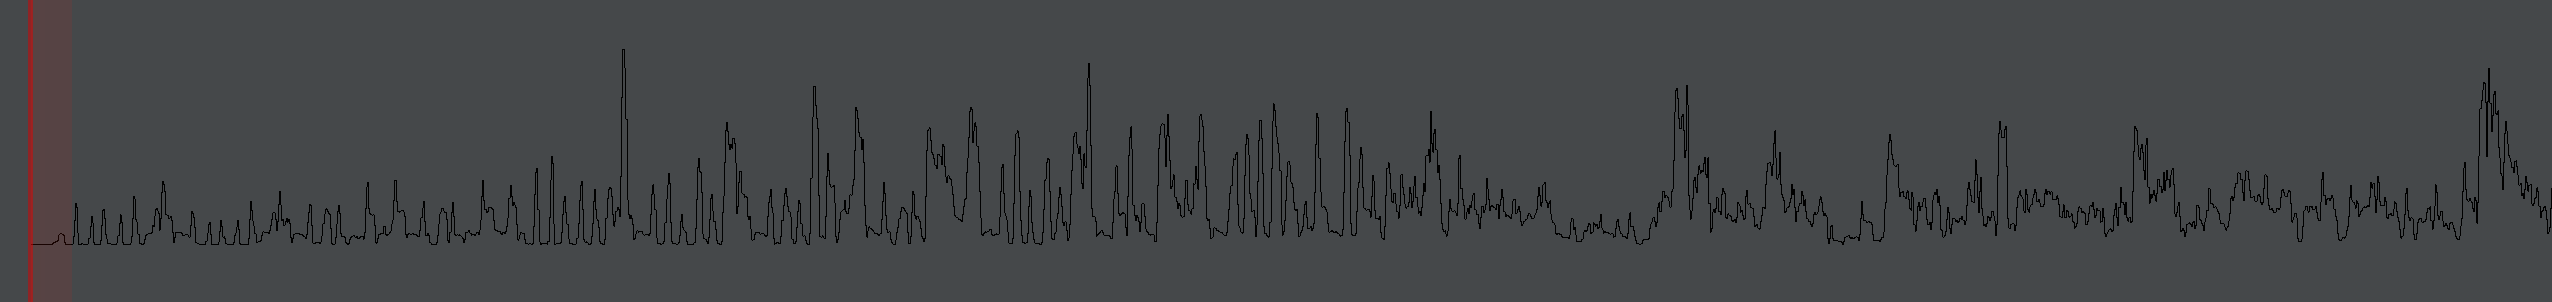
If you stare at it you can quite clearly see the beat structure of the underlying music. The “spectral_energy” analysis is your best bet for corresponding to instantaneous ‘loudness’. Other interesting analyses, with exotic names, include:
spectral_centroid— a kind of broad pitch estimation — higher numbers correspond to higher pitch things, but this works best with non-tonal materialspectral_energyband_low,spectral_energyband_middle_low,spectral_energyband_middle_high,spectral_energyband_high— correspond to energies in the bass through to the treble.pitch_salience— a number between purely pitched / musical (1) and noisy (0).spectral_complexity— how complex the sound is.spectral_flux— how rapidly the sound is changing nature.spectral_rms— another candidate ‘loudness’.zerocrossingrate— will vary based on noise and higher pitches.dissonance— another candidate pitch vs. noise analysis.
These all return the same thing: given a ‘time’, they’ll give you a number. For various sonic materials you’ll find that these analyses pull out various things that you might want to map to various motions and animations. Consider these as potential motors for movement or geometry creation, remembering that, to access the value of the analysis that’s at ‘this moment in time’ you’ll want:
var value = analysis.getNormalized("spectral_energy", _.time.frame.x / 24)