Basic Drawing
Let’s start with the simplest possible example — drawing a single line in Field:
var someLine = new FLine()

someLine.moveTo(40,20)
someLine.lineTo(200,50)

_.lines.clear()
_.lines.add(someLine)
Congratuations! when you run this code (alt/option - up-arrow), you’ll get something that looks like:
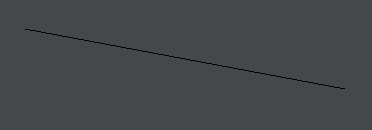
That will be sitting in the “top left hand corner” of your sceen. You have drawn a line in Field. Let’s figure out what it all means.
Line by Line
This simple code has three parts. First we make a new FLine — which is short for Field Line — which is a place were we can put drawing instructions:
var someLine = new FLine()(peach23, i, __hello_world_ are all fine potential names of things, my great line, 3here, var aren’t — the first has spaces in it which completely confuses the computer, the second starts with a number which just isn’t allowed, and the last one is a word that already has meaning in this computer language).
We can call someLine anything we want, as long as it’s a valid JavaScript name.
Two questions: Firstly, take a minute to figure out which way up is: (40, 20) and (200, 50) in the code above?
What do they mean?
Secondly, Keep asking who is talking and where? var is part of JavaScript, FLine is part of Field and someLine is part of your code. What about _ and _.lines or _.lines.clear() ?
Then we do some drawing:
someLine.moveTo(40,20)
someLine.lineTo(200,50)
You can think of this as putting the pen down at position [40, 20] and drawing a straight line until [200, 50]. You’ll note that the origin ([0,0]) is at the top-left and the x axis heads left and the y axis heads down.
This “standard” is common throughout 2d computer graphics (it’s the order that the image is stored in for one, and it’s the order that images are relayed to monitors for another, mostly because it’s the order that old TV’s used to scan their phosphor dots with their electron beams. It’s also, in turn, the order that most languages are read in — left first then down.)
Finally, we take our someLine and we tell Field we’d like to draw this line (and nothing else) when it draws the screen next:
_.lines.clear()
_.lines.add(someLine)
If we miss any of these three steps, we’ll end up with nothing. This can be very frustrating. Keep going and look at any error messages (which will appear in red boxes) or hints (yellow warning signs and squiggles decorating your code). Capitalization is very important, punctuation is very important, much more so than in human languages. Computers expect and demand precision and aren’t always precise about what’s wrong with what you typed.
Other drawing frameworks that might be familiar with skip one of these pieces. Processing[.js] for example mostly skips the container. This means that all drawing happens as soon as you talk about it, the equivalent in Processing to all of our code here is simply line(40,20,200,50) — in a sense you can think of this approach as ‘all verb and no noun’. This is undeniably less typing, but it’s also less powerful — for example: it’s easy to see that we can’t draw more than one complex gestural lines at the same time. More subtly we can’t write code that does things to lines without introducing our own notion of what it means to store a line (e.g. a noun). Most sophisticated code in Processing.js abandons this immediate mode in favor of an intermediate object.
For example, if we forget to create a new FLine called someLine then we’ll get an error – right when we utter the name of something that doesn’t exist later on; if we forget to actually put some drawing instructions into the line (using things like moveTo and lineTo or ) then there will be nothing to draw; and if we forget to add it to the list of lines on the screen then, while the line will exist just fine, but since we’ve never asked to actually see it, we won’t.
And… that’s it! At a certain level, this is close to all that you need to know. Further knowledge about drawing lines fits into this tripartite structure. Specifically: there are a few additional ways of making new lines (mainly by transforming other lines); there are many different ways of drawing to lines; and there are a few different ways (and places) to make them visible. These three groups of activities are documented in the reference documentation, illustrated in the recipes below, and structure the templates and exercises in class.
Introduction to styles
In addition to operations such as .lineTo that add geometry to an FLine, there’s a set of parameters that control how that geometry is drawn. Let’s start with a slightly more interesting line:
var ll = new FLine()

ll.moveTo(40,20)
ll.lineTo(200,50)
ll.cubicTo(20,50,200,100,150,150)
ll.cubicTo(120,50,100,200,50,50)

_.lines.clear()
_.lines.add(ll)
We’re calling it ll just to save on typing; ll is a name that we give our particular FLine, it can be anything we want it to be. We are also eliding the invocations of moveTo and lineTo and cubicTo together. This code draws the vanilla looking →
Now lets add some styles:
var ll = new FLine()

ll.moveTo(40,20)
ll.lineTo(200,50)
ll.cubicTo(20,50,200,100,150,150)
ll.cubicTo(120,50,100,200,50,50)

ll.color = vec(1,1,1,1)

_.lines.clear()
_.lines.add(ll)
And the line is now white, rather than black →
ll.color = vec(1,1,1,1) is the extra magic here. This sets the color of that line to be vec(1,1,1,1). Colors, in Field, are a set (a ‘vector’) of four numbers from 0 to 1 that specify the amount of red, green and blue light in the color together with the opacity of the color.
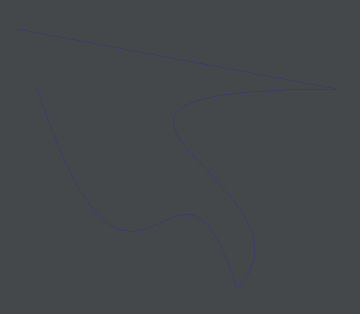
ll.color = vec(1,1,0,0.5)Is a 50% opaque yellow (red(1) + green(1), no blue(0) at 50% (0.5)) →
Likewise:
ll.color = vec(0,0,1,0.15)Is a barely visible 15% opaque blue →
Think of these colors as 4-dimensional vectors.
ll.color = vec(0,0,1,0.15) // very thin blue
ll.color.r += 0.5 // now with much more red in it
ll.color.a = 1  // now completely opaque
Planes and points
FLines, as the name suggests, contain the kind of geometry can that be specified by drawing lines. But this doesn’t mean that we have to draw these lines as lines. The most important alternative rendering style is:
ll.filled = trueWhich causes Field to work out what’s inside the line, and shade it →

And .color styles are applied to this fill as well as the line itself (called the stroke):
ll.filled = true
ll.color = vec(1,0,0,0.4)
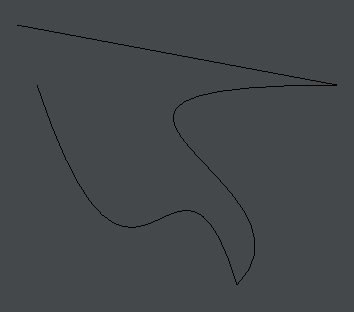
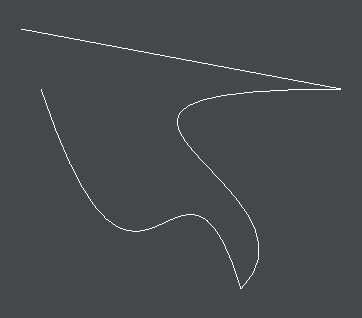
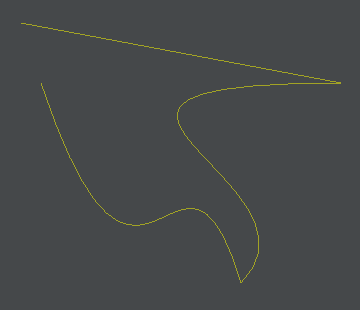
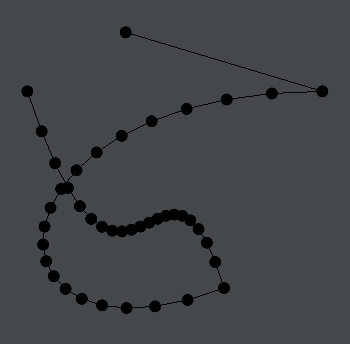
Field’s notion of “inside” is robust and detailed. If we modify the shape slightly
var ll = new FLine()
ll.moveTo(100,20)
ll.lineTo(200,50)
ll.cubicTo(20,50,20,200,150,150)
ll.cubicTo(120,50,100,200,50,50)
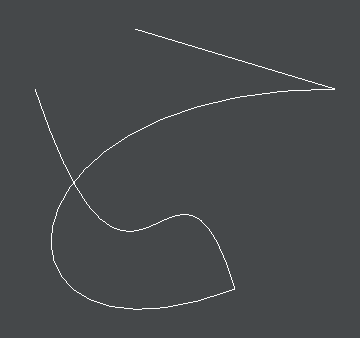
ll.filled = false
ll.color = vec(1,1,1,1)
_.lines.clear()
_.lines.add(ll)We’ll get this shape →
Which when drawn with .filled=true gives →

Two things to notice: 1) both parts of this shape are filled in and 2) the ends of the line are simply “closed” with a straight line, in order for it to “finish” containing an area.
If we like we can style the fill and the stroke with different colors.
ll.filled = true
ll.fillColor = vec(1,1,1,0.2)
ll.strokeColor = vec(0,1,0,1)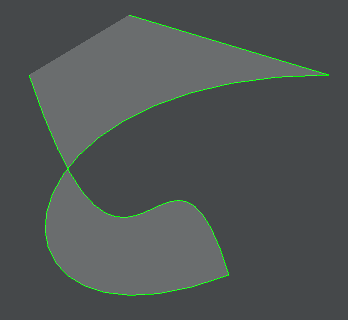
This makes it easier to see how the stroke determines the fill. Setting:
ll.stroked = falseWill eliminate the stroke from a line, rendering it invisible.
Finally, following Kandinsky:
ll.pointed = true
ll.pointSize = 10
Draws decorated with points at each of the vertices that connect the lines together →
Note that pointed draws points even when you might end up with no lines or any enclosed area. A single .moveTo is enough to make a point (where it doesn’t make a line and certainly doesn’t describe an area). You can write code like:
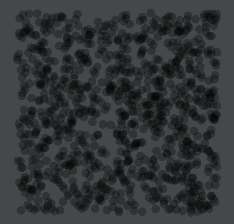
var ll = new FLine()

for(var i=0;i<1000;i++)
{
	ll.moveTo(vec(Math.random(),Math.random())*100)
}

ll.pointed=true
ll.pointSize=3
ll.color=vec(0,0,0,0.3)

_.lines.clear()
_.lines.add(ll)
To get 1000 translucent points randomly scattered over a 100 x 100 area →
Start exploring
This is all you need to start exploring. In fact all of the styles that you can set on a line are shown in the autocomplete. Type the name of an FLine and ask for possible completions after the dot (.):
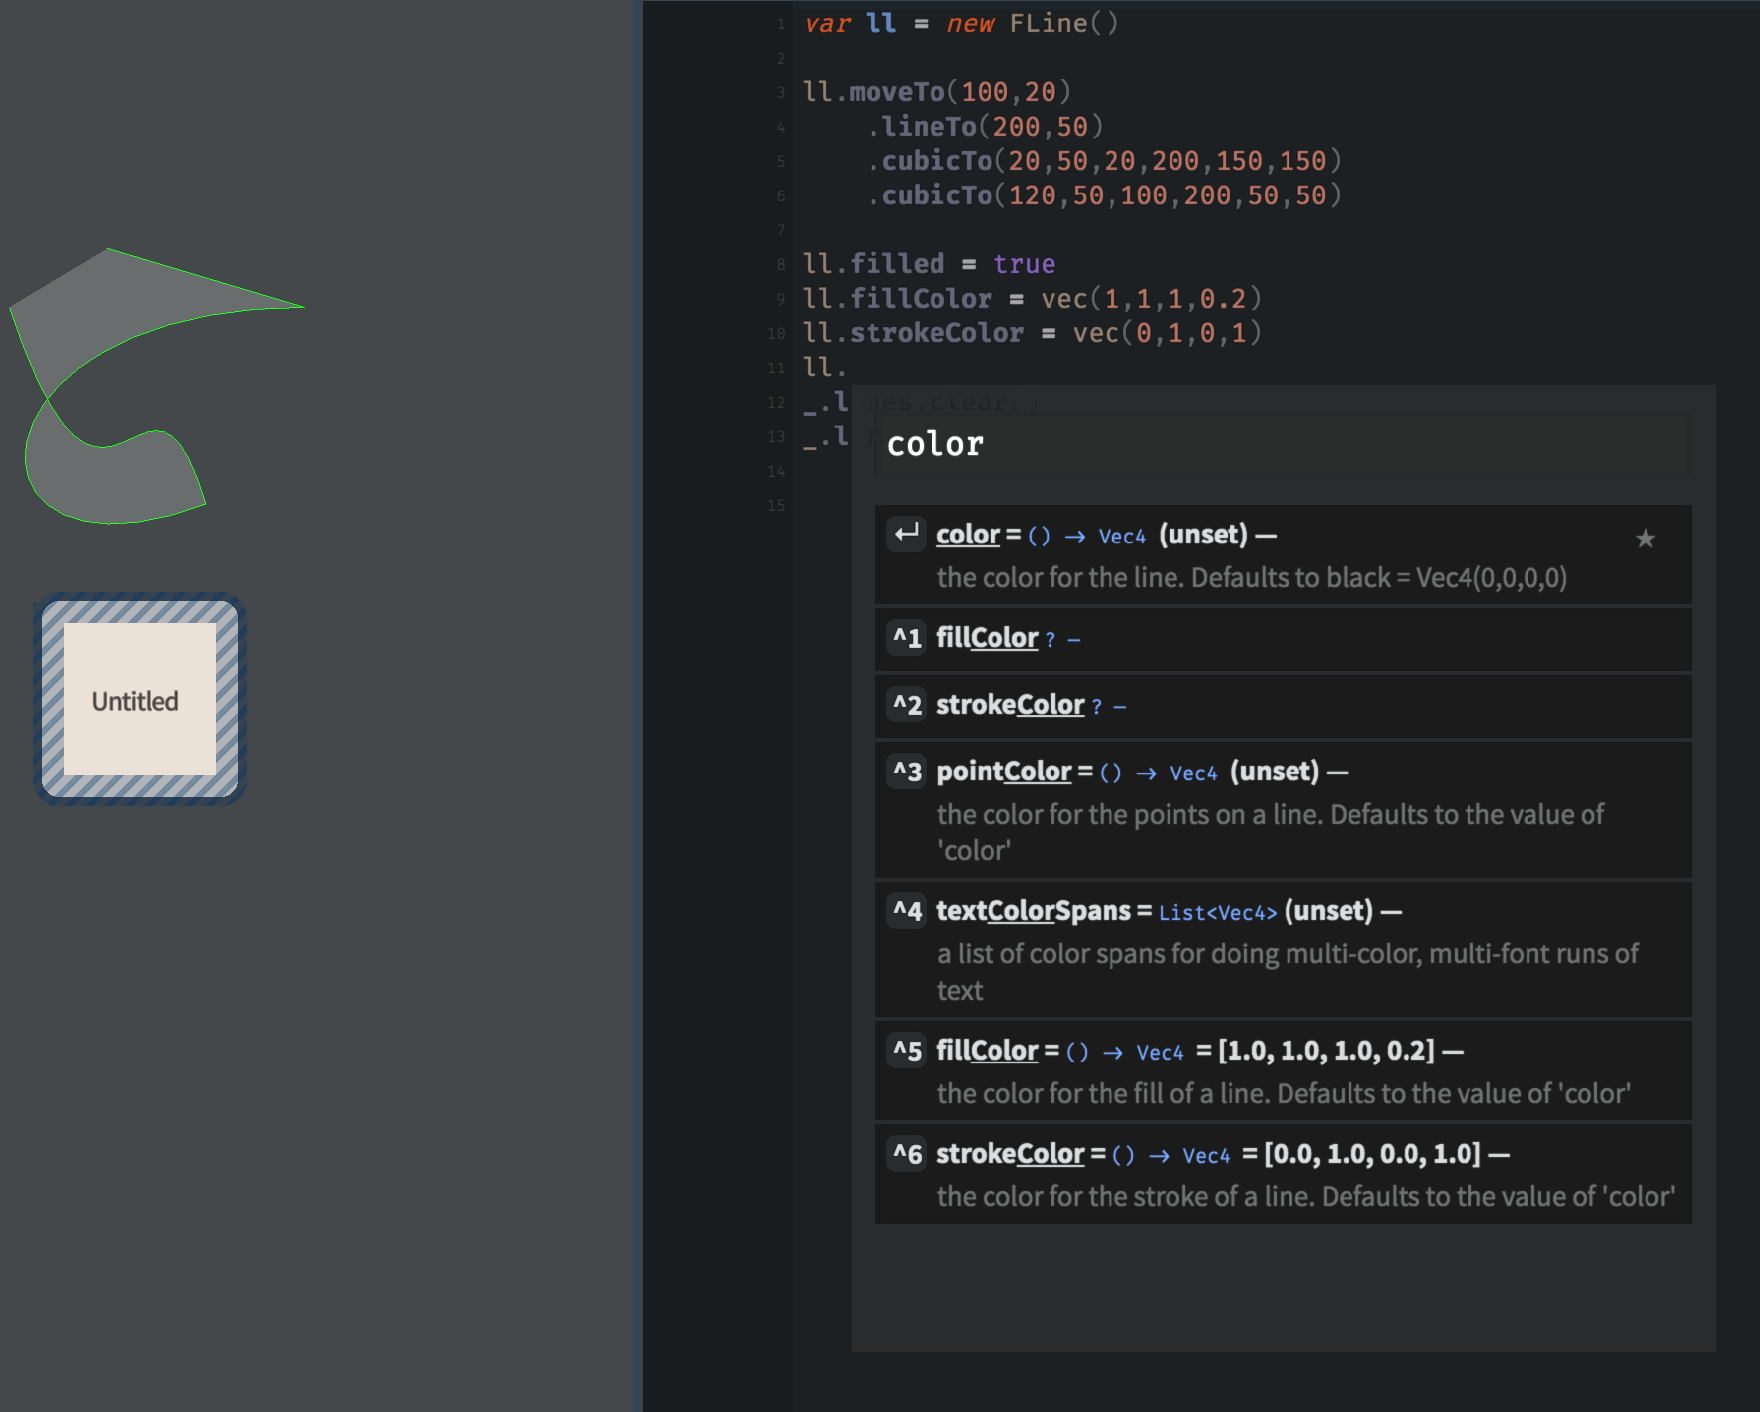
Typing into the search box searches over all of the things that Field can do to an FLine.
More complex geometry
Let’s take a closer look at how an FLine describes a shape. This will let us tour some useful ways of creating shapes, and some handy math behind them. Let’s take this code here:
// build a curve
var f = new FLine()
f.moveTo(0,0)
f.cubicTo(50,0,20,100,200,100)

// make it a transparent red
f.color = vec(1,0,0,0.5)

// and thick
f.thicken = 2

// make it 'tweakable'
f.tweaky=true

// add it to the list of lines
// to be drawn with this box
_.lines.f = f

// apply any 'tweaks'
_.applyTweaks()
That code yields a drawing that looks like:
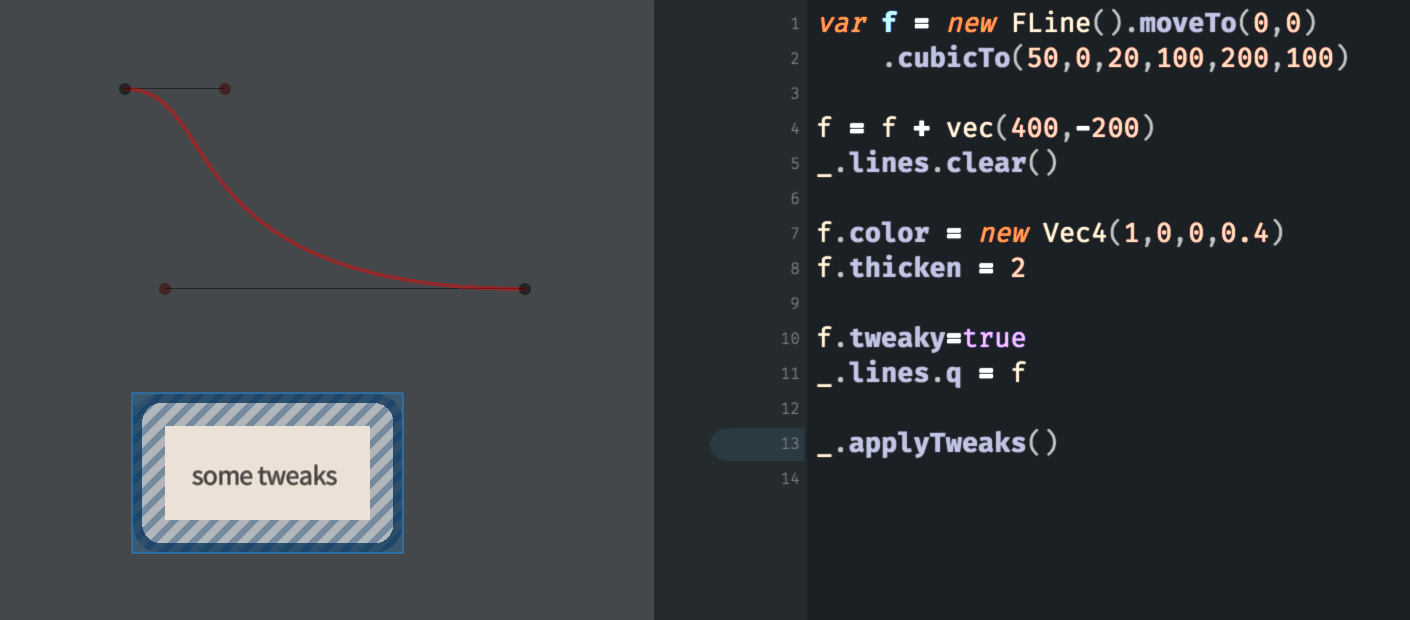
We’ve introduced Field’s ‘tweaks’ system here mainly to illustrate the nature of how that parametric curve is constructed. If we look at the code we see four sets of coordinates. In turn we have (0, 0) (where the curve starts), (50, 0) (the first ‘control point’, off to the right), (20, 100) (the second ‘control point’, down) and the last point (200, 100), which is where the curve ends up. Note that, since the control points are on the same horizontal as the start and end points the curve exits and enters its start and end going horizontally.
This kind of curve — both the shape and the way that it is controlled — is called a “cubic Bézier spline” (and that’s a perfectly comprehensive Wikipedia article on it). It has a long history (that predates computer graphics), it appears in essentially every computer drawing tool, current operating system, webpage and printed page etc. — it’s fundamental even to the way that this font you are reading right now is drawn on screen. If this is new to you in Field you can grab hold of those points and move them around to get a feel for how the points relate to the overall curve.
All the other things that we can do to FLines, are, essentially, increasingly more general ways of making these curves. For example, this code uses polarCubicTo to specify a curve based on the ‘speed’ and ‘angle’ into the endpoints:
for (var theta of Anim.lineRange(0, 360*10, 1000))
{
	var f = new FLine()
	f.moveTo(0,0)
	f.polarCubicTo(1,90,1,theta,200,100)

	f.color = vec(1,0,0,0.4)
	f.thicken = 2

	f.tweaky=true
	_.lines.f = f

	_.applyTweaks()
	_.wait()
}
We are using _.wait() (which causes the code to ‘wait’ for the next frame of the animation) and Anim.lineRange to produce a sequence of numbers (here from 0 to 3600 in 1000 steps). This yields:
As always, you can discover more about polarCubicTo by asking for autocompletion on an FLine and just using it and playing with its parameters:

A Math of Shapes
The main feature of drawing to an FLine and then opting to place that on the screen (rather than, say, drawing to the screen directly) is that you can manipulate the FLine (as a whole) before you draw it (if you draw it). This makes it much easier to build interesting forms, by editing and transformation, rather than specifying them all in one go. Let’s start with this code:
var f = new FLine()
f.rect(0,0,200,200)

var redOne = f * rotate(10, 100, 100) // !

redOne.filled=1
redOne.color=vec(1,0,0,0.5)

_.lines.redOne = redOne
Yield this rotated red square:

Consider the flow of the code: we drew a rectangle (actually a 200x200 square) then we rotated by 10 degrees around the point [100, 100]. We didn’t need to go hunting for a ‘draw a rotated rectangle’ instruction.
This line needs some special attention:
var fRotated = f * rotate(10, 100, 100)That’s taking a FLine called f and multiplying it by a rotation created by rotate. An FLine times a rotation gives an Fline — multiply here is being used to indicate the application of a transformation. There are a full compliment of other transformations, including things like:
scale(0.2)— scales everything by x0.2, that is makes everything 1/5th of the sizescale(0.2, 2)— scales everything by x0.2 in the horizontal and x2 in the verticalscale(-1, 1)— reflects everything around the y axis / horizontallytranslate(200,10)— moves everything right by 200 and down by 10; this is a lot like just ` + vec(200,10)` in many cases.
scale and rotate transformations come with extra parameter slots at the end that change the pivot point (e.g. where we are rotating around). Alternatively, one can write ` * scale(1,2).pivot(100,50) ` to change the pivot point of a transform. Otherwise transforms likes scale scale things towards and away from the origin which isn’t always what you want. You can chain transformations together. For the record these two things are the same:
f = f * translate(-100,-100) * rotate(10) * translate (100,100)And
f = f rotate(10, 100, 100)
// or
f = f rotate(10).pivot(100,100)
You should take a movement to convince yourself of this.
Furthermore, the following code works just fine as well:
var myVector = (vec(1,2,3) + vec(3,2,1)) * vec(0,1,0) - vec(2,3,4) * 2.4Addition, subtraction and multiplication by anything distribute over list structures. Therefore this little blue square:
var little = new FLine().rect(0,0,100,100)

little.filled = true
little.color = vec(0,0,1,0.5)
_.lines.little = little
can be added to a list of, say, vec:
var lots = little + [vec(100,0), vec(300,0), vec(700, 200)]

lots.filled = true
lots.color = vec(1,0,0,0.5)

_.lines.lots = lots
To yield lots, a line made up of three copies of little each translated a different amount →
There’s nothing special about those vec, we can have:
var lots = little + [rotate(230), rotate(120), scale(0.5), translate(80,80)]To yield:

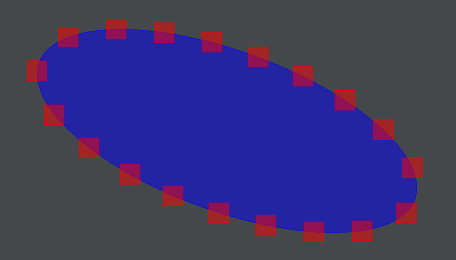
We can also get our lists from FLine (.bySampling(20) pulls out 20 points from an FLine, see the autocompletion for more help):
var big = new FLine().circle(0,0,100)

big.filled = true
big.color = vec(0,0,1,0.5)

big = big * rotate(30) * scale(1,0.4) * rotate(20)

_.lines.big = big

var little = new FLine().rect(-5,-5,10,10)

little.filled = true
little.color = vec(1,0,0,0.5)

// here we multiply 'little' by a list sampled from the line 'big'
_.lines.little = little + big.sampleByNumber(20)
Yields:
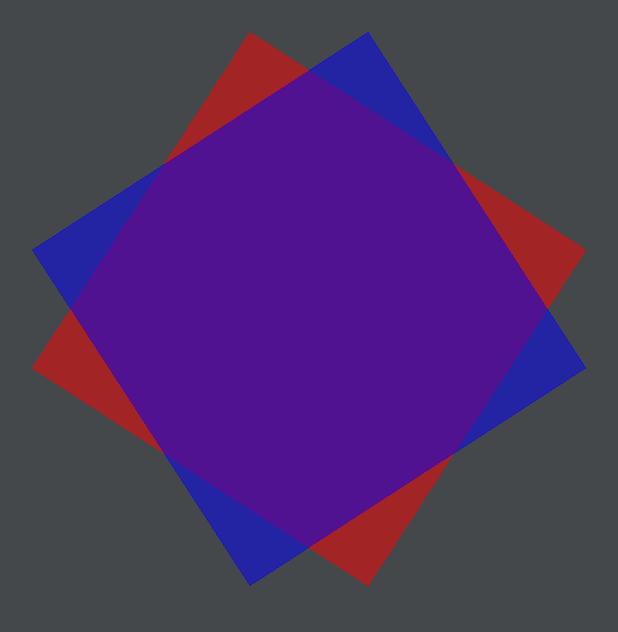
Multiplication by a transform is not the only thing that we can do to an FLine, we can add, subtract and multiply FLines together. Let’s draw two squares:
var f = new FLine()
f.rect(0,0,200,200)

var redOne = f * rotate(10, 100, 100)

redOne.filled=true
redOne.color=vec(1,0,0,0.5)

_.lines.redOne = redOne

var blueOne = f * rotate(-10, 100, 100)

blueOne.filled=true
blueOne.color=vec(0,0,1,0.5)

_.lines.blueOne = blueOne
They overlap:
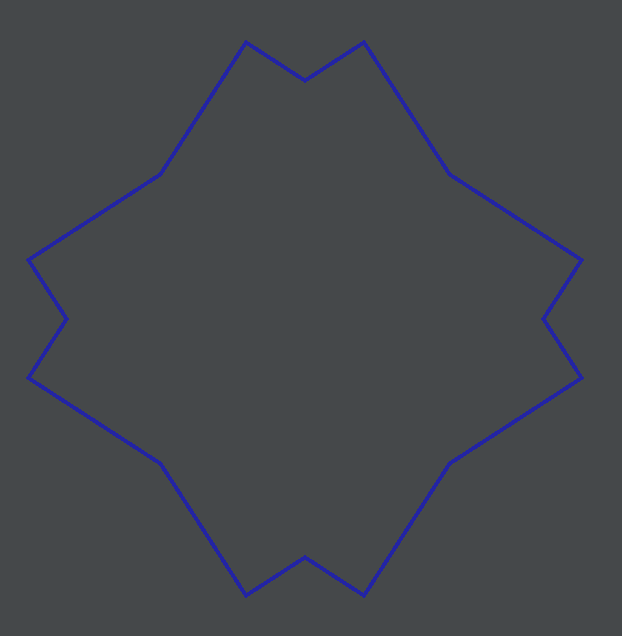
What happens if we subtract the red from the blue:
_.lines.clear()

var f = new FLine()
f.rect(0,0,200,200)

var redOne = f * rotate(10, 100, 100)
var blueOne = f * rotate(-10, 100, 100)

blueOne.filled=true
blueOne.color=vec(0,0,1,0.5)

_.lines.blueOne = blueOne - redOne
Yields:

As you can see blueOne - redOne has the attributes of blueOne (it’s filled and blue) but it’s missing wherever redOne was. It’s important to realize that this isn’t an image compositing operation, the actual geometry of blueOne - redOne is being (carefully) computed. We can subject it to further manipulation, just like any other FLine. It’s also important to note that this math works out only for enclosed areas — you’ll want to “thicken” lines to given them areas before manipulating them with other lines (see below).
We can also add (blueOne + redOne, we’ve dropped the fill so you can see that it’s an actual contour rather than just two squares on-top of each other):
The last operation available is multiplication (blueOne * redOne) which should be read as “intersection”:

In general intersection, addition and subtraction is a powerful way of building complex geometries that still feel like their origins are bounded in a physically understandable process. Explore!
Thickening lines
One of the challenges in, translating the concept of “line” from, say, Kandinsky or Klee to code is that an FLine line is a perfect, mathematical line; lines everywhere else (other than your head perhaps) have thickness. Even when they appear on the screen, Field has to give them some kind of thickness. Let’s look at this gesture here:
var f = new FLine()
f.moveTo(10,10)
 .lineTo(150,150)
 .polarCubicTo(1,29.73,3,50,292.70,161.05)
 .polarCubicTo(1,-40,1,30,400,230)

_.lines.f = f
Yielding, this razor thin line:
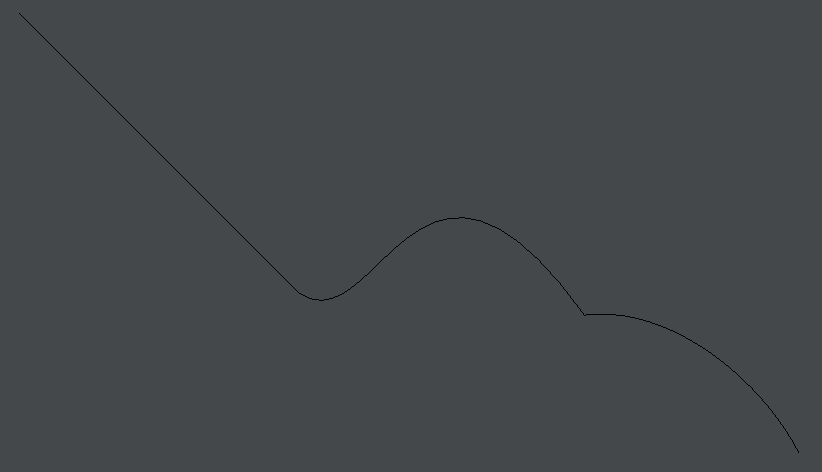
Field has three ways of thickening this line up. The first is slower to compute, quick to write, more accurate, and doesn’t come with a whole load of options.
Adding f.thicken = 10 to our code gives
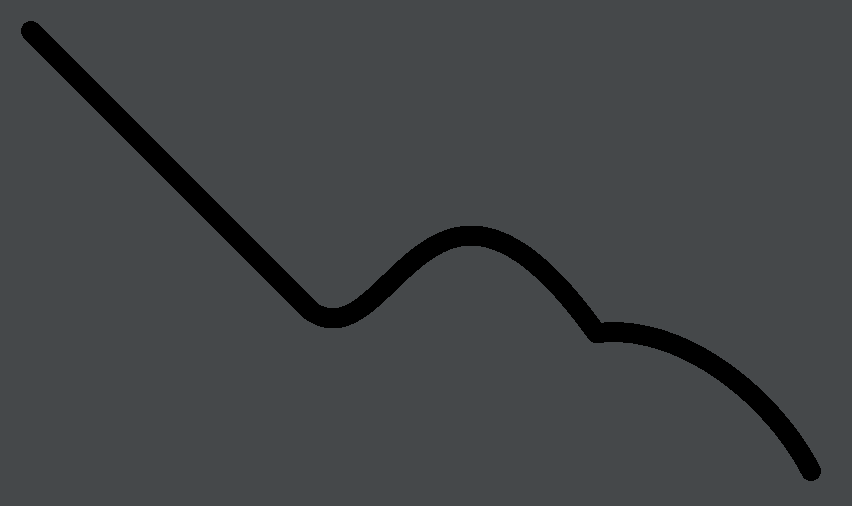
This line is pretty much exactly the outline you’d get if you traced a circle of diameter 10 down the line as a whole. Due to various mathematical intrigues, that precise shape can take a surprisingly long time to compute in the general case, and Field tries hard to do a very good job of it (in the case of overlaps in particular). f.thicken=5 changes how the line is drawn, but it doesn’t change what the line is (which is why it is a property on the line like color). It certainly is possible to give Field a computation that it cannot complete in a reasonable time by thickening a 1000 point self intersecting line…
Alternatively, you can always try:
f.fastThicken = 10
This will, for the simple common cases, yield something that looks acceptable — it will be lacking the elegant ends, carefully mitered joins etc. But it will be much, much faster.
In the middle, between the two, there’s another, final way to thicken a line. Faster than .thicken to compute, more sloppy, yet more interesting is this code:
var f = new FLine()
f.moveTo(10,10)
f.lineTo(150,150)
f.polarCubicTo(1,29.73,3,50,292.70,161.05)
f.polarCubicTo(1,-40,1,30,400,230)

var fThick = f.byThickening(10)

_.lines.f = fThick
line.byThickening( thickness ) returns new geometry that has been thickened by thickness:
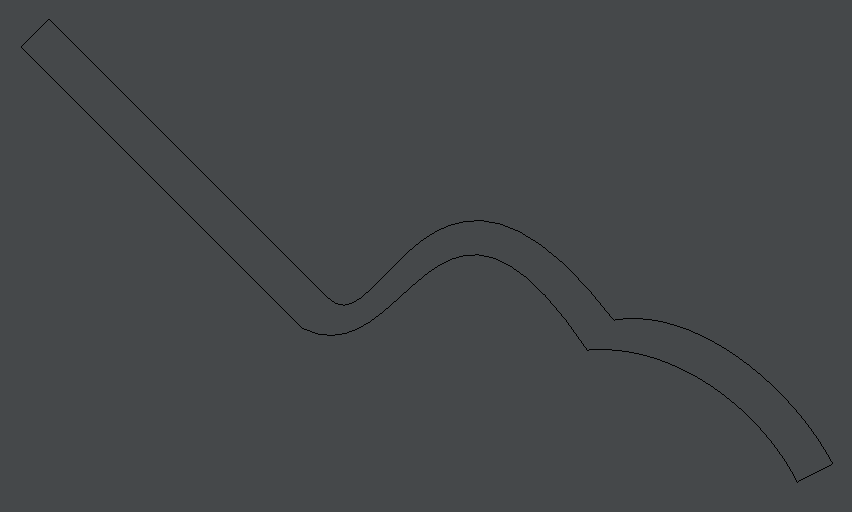
If we set fThick.filled=true on that:

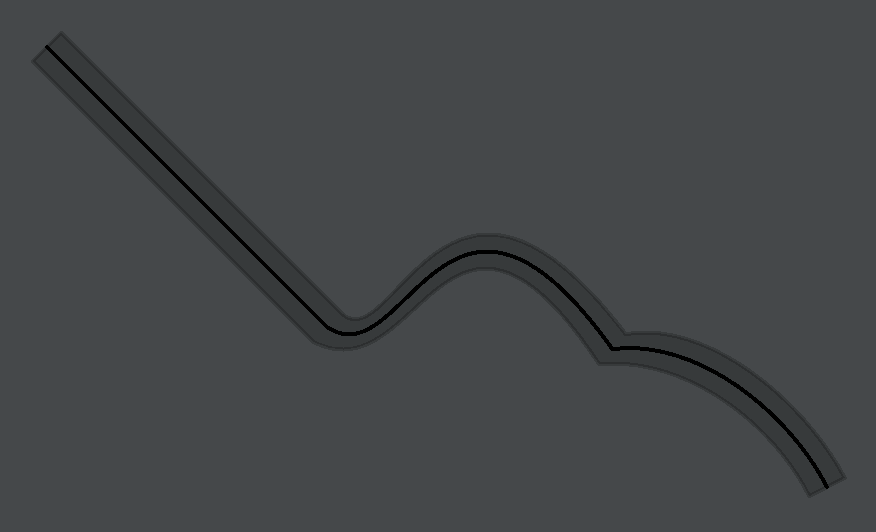
We can see that the actual thickness isn’t quite constant (it looks a little more like calligraphy to my eye). If we add back in the original line we can see a little better what is going on:
.byThickening() has all kinds of other options. It stores the thickness inside properties inside the line. For example this code (with the original line showing as well):
var f = new FLine()
f.t = 0.0 // sets the default for the whole line
f.moveTo(10,10)
// sets the thickness at this point on the line
f.node().tR = 40.0
f.node().tL = 10.0
f.lineTo(150,150)
// the thickness here is unset, and thus zero
f.polarCubicTo(1,29.73,3,50,292.70,161.05)
// but at this point in increases back to '40'
f.node().tL = 40.0
f.polarCubicTo(1,-40,1,30,400,230)
// 'left' and 'right' thicknesses can be set
// independently
f.node().tL = 20.0
f.node().tR = 50.0
fThick = f.byThickening(1.0)
fThick.filled=true
fThick.color=vec(0,0,0,0.2)
_.lines.fThick = fThick
_.lines.f = f
Yields this interesting gesture:

The .tL and .tR properties set the ‘left’ and the ‘right’ thicknesses of a line (if there are set on the line as a whole) or on just a single drawing instruction (or node()) of a line. See if you can trace through the above code to come up with an explanation for the shape to you.
If we turn on tweaky to see the actual points and cubicTo that make up this thick FLine we see:
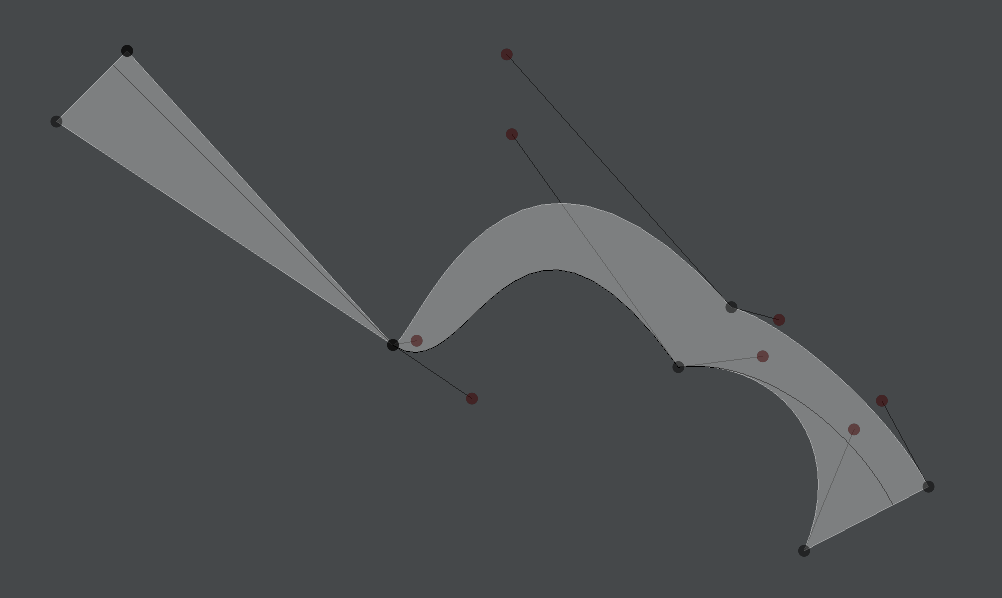
Which has its own Bauhaus thing going on already.
FLine introspection
Finally we can write code that looks into the contents of lines in various ways. This is needed if we are to build processes that take lines as input.
Let’s start with a test curve:
var f = new FLine()
f.moveTo(10,10)
f.polarCubicTo(1,20,2,-40,300,100)
f.polarCubicTo(1,-30,2,-40,200,200)
f.polarCubicTo(1,-30,2,-40,300,200)
Which looks like:
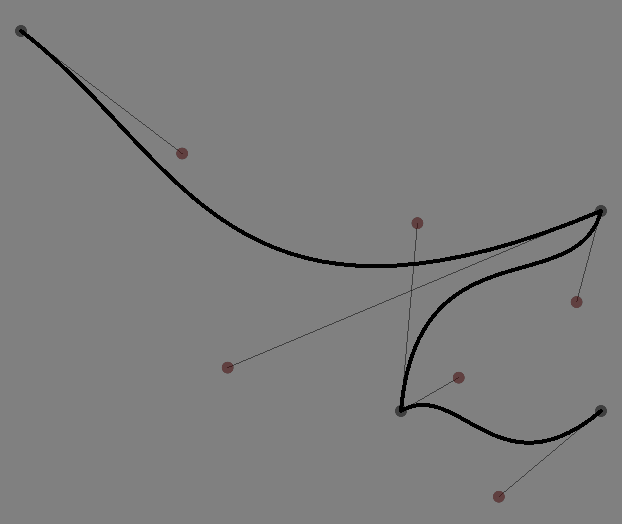
Firstly, given a line f we can ask it for the drawing instructions that it contains back:
var somePoints = new FLine()

// draw a point at 'f.nodes[2].to`
somePoints.moveTo(f.nodes[2].to)

somePoints.pointed=true
somePoints.pointSize=20
_.lines.somePoints = somePoints
Note: JavaScript arrays like f.nodes and like the overwhelming majority of programming languages are 0 based. That is, the first thing in the list (in this case the moveTo is element [0], the second is [1] and so on. This makes ordinal naming difficult and everything else easier.
That draws a point at f.nodes[2].to — specifically where drawing instruction number ‘2’ draws to:
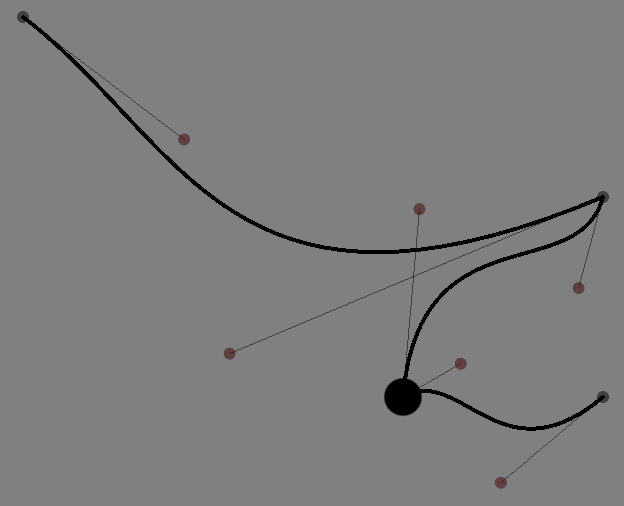
You can ask for auto-completion on f.nodes[2]. to see other things that you can do with a node. If it’s a .cubicTo (which in this case it is), you can also ask for c1 and c2, the two control points.
This actually covers everything you need to know to pull out the drawing instructions that go into a line. But what about the line itself (i.e. the parts between the tos)? First of all, and easiest of all, we can do this:
somePoints.moveTo(f.sampleAt(0.5))That yields this point here:
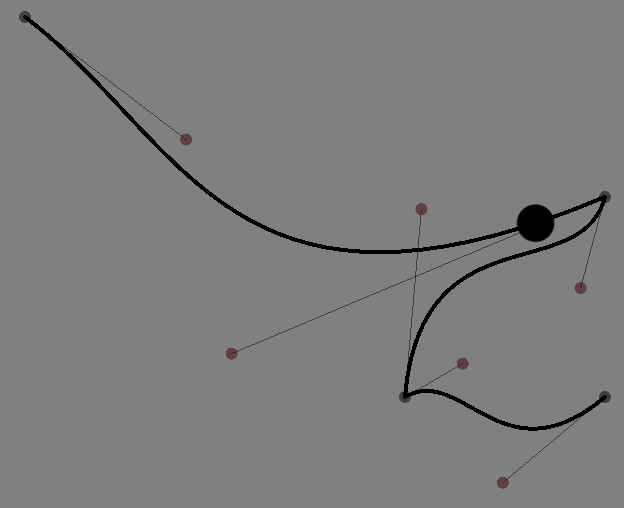
Which is the midpoint of this line (exactly 0.5 of the way through) — if you took out a piece of string, placed it carefully along the line, that point would be halfway along the piece of string. If we’d asked for 0.1 we’d have gotten a point 10% from the start, 1 would give us the end-point. There’s a small family of sampleBy... methods including sampleByNumber(n) which returns a list of n points evenly spaced from the start to the end. sampleByDistance(d) which returns a list of points spaced d apart (which is unlikely to include the end-point unless the line is some multiple of d long). Again, check auto-complete for information.
Finally, for complete control there’s a new object, a ‘friend’ of FLine, the Cursor:
var cursor = f.cursor()
var length = cursor.lengthD()
var h = new FLine()
for (var a of Anim.lineRange(0, 1, 100))
{
	cursor.setD(length*a)
	h.moveTo(cursor.position())
	h.lineTo(cursor.position()+cursor.normal()*0.2)
	h.lineTo(cursor.position()+cursor.normal()*0.2+cursor.tangent()*0.1)
}
_.lines.h = h
Draws:
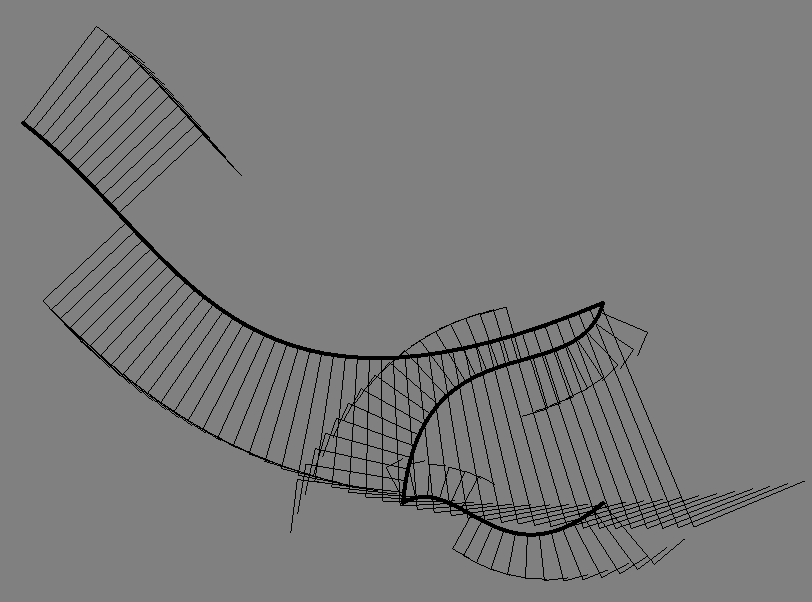
This illustrates the basic usage for cursors — there’s setD(d) and setT(t) for moving along the line by distances (d) and by drawing instructions (t); methods for querying the overall length lengthD() of a line and the number of drawing instructions lengthT(), methods for finding out where in space the cursor is, and what the ‘normal’ (the line that’s perpendicular to that point) and ‘tangent’ at that point is at. There are also methods for splitting an FLine into two FLines at the position of the cursor — this can be very handy for animating a line drawing in for example. As always, check the auto-complete.