
Intersections
or, how to add notation to the timeline
For those of you who know one of the 100 multi-media production tools that feature a time-line, you’ll be familiar with something that looks like:
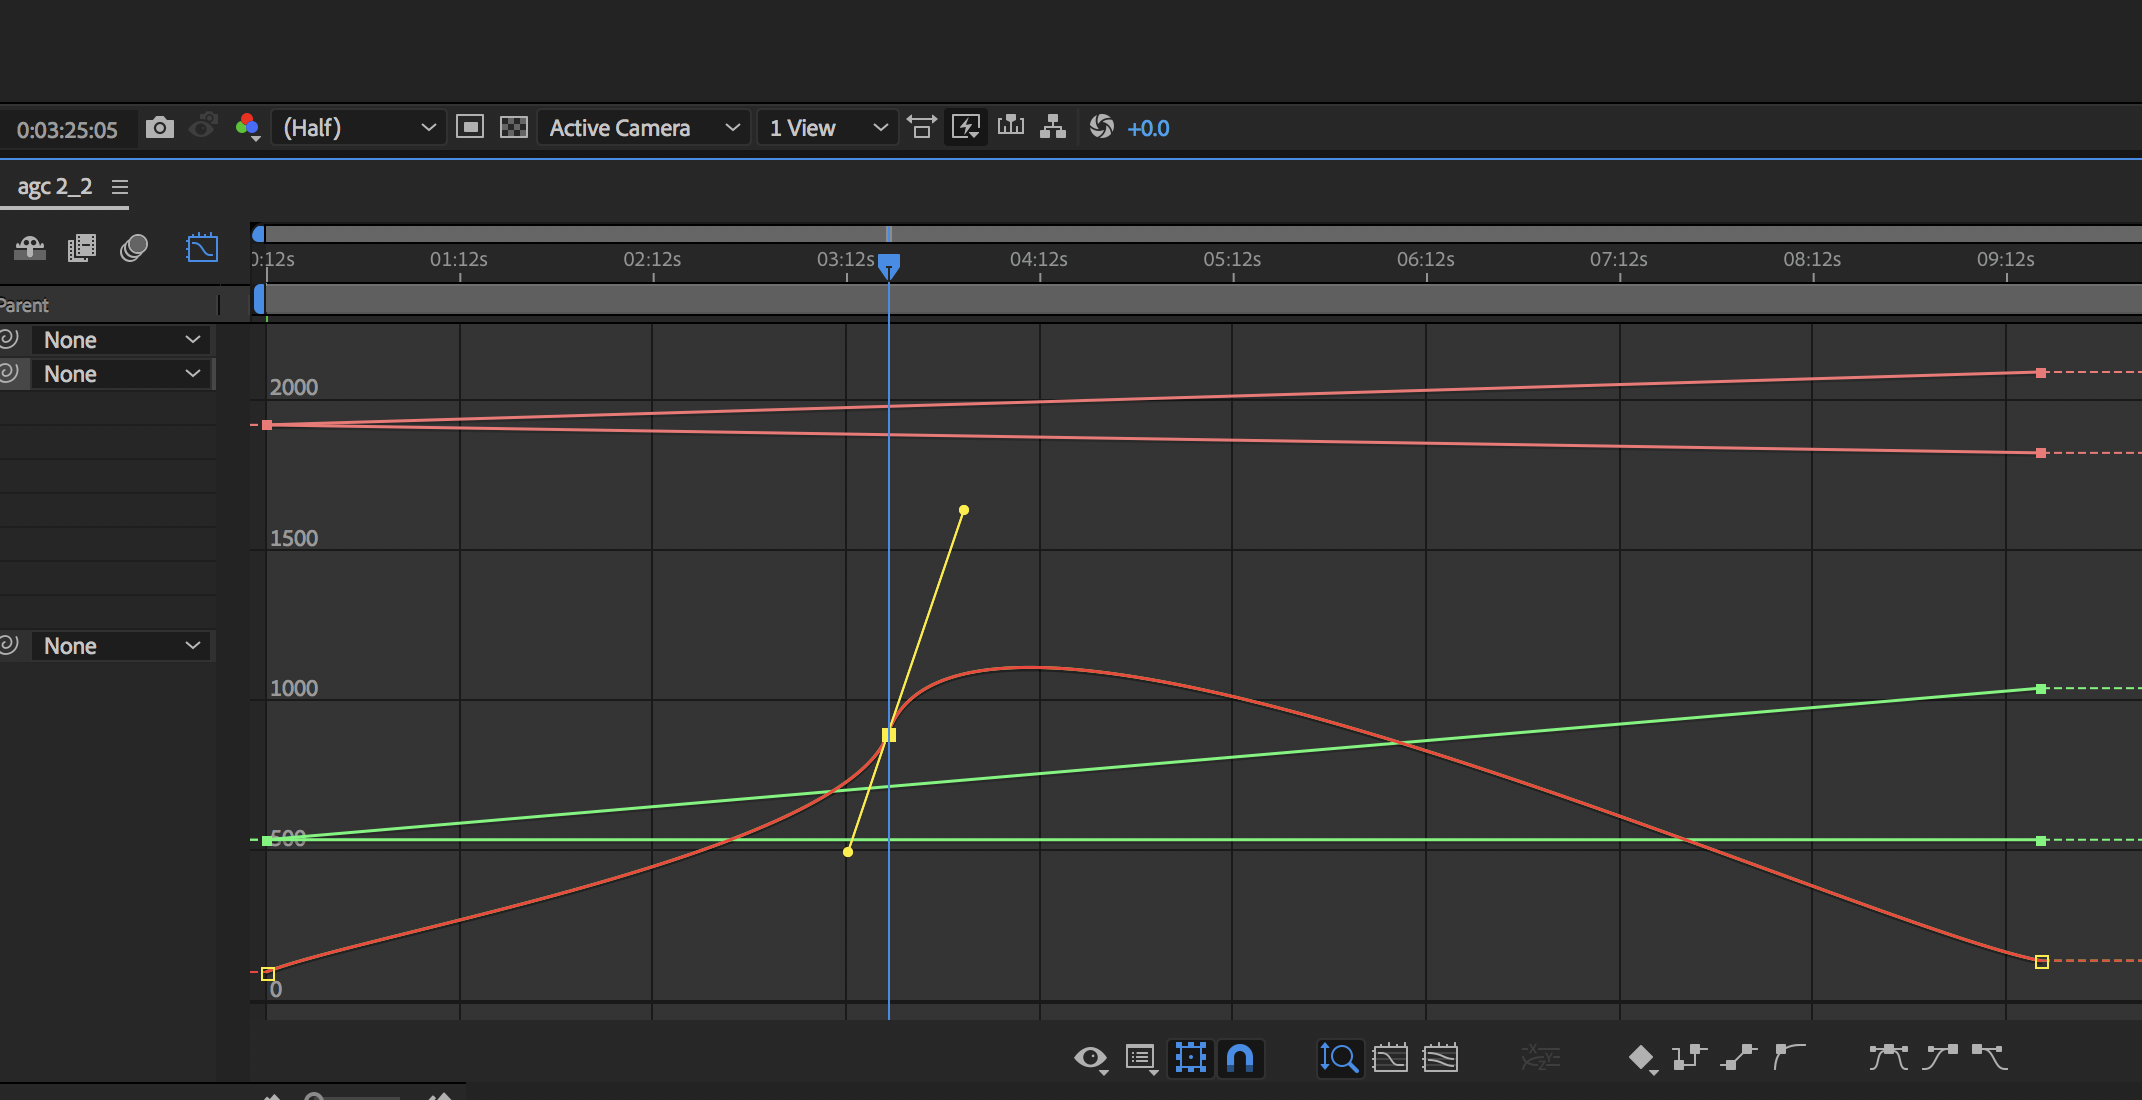
This is the ‘keyframe editor’ or, sometimes, the ‘graph editor’. This “user interface” serves two functions. The first is obviously to let you build and edit “curves”; the second is even more obvious: it’s to let you see the curves in the first place. This visualization is a form of notation.
Part of the reason that writing, interacting with and thinking about code to make images is difficult is that code is very counter-visual: it’s text-based, time flows through it in loops and so on. Field supports manipulating time visually, by building timelines, but what else has it got to offer in terms of visualizing the inputs and outputs of code?
Two “features” added to Field move in this direction. The first is a ‘grease pencil’ function that lets you draw FLines directly onto the worksheet with the mouse (or a Wacom tablet if you have one). The second is a simple way of asking where lines are intersected by vertical lines. Together, or apart, this lets you explore other notational strategies and drivers for values that enter your code. They also complete a recursive form: Field can use drawings to manipulate code to produce drawings.
The grease pencil
Adding the grease.pencil template adds functionality to Field:
After it has been loaded you can draw directly on the canvas whenever there’s a box that’s selected, and you are holding down p. Conceptually this is adding a line called _.pencil to a box (and as _.lines.pencil). So boxes can ask of the FLine that’s been drawn into them by asking for _.pencil. Additionally, this line moves when you move the box that it’s in around. You should remember that n quickly lets you make a box under where the mouse is. This should let you move around making boxes, selected them and drawing into them.
P (canvas) — draw with the ‘grease pencil’ into the currently selected box
Right clicking on any box and gesturing towards ‘remove pencil’ from the marking menu will delete the pencil mark from the box.
Unlike the contents of _.lines more generally _.pencil is saved with your document (and bundle) and reloaded when you open a file.
Of course, with a little bit of effort you can cause _.pencil to appear on a Stage as well, e.g.:
var p = _.pencil - vec(_.frame.x, _.frame.y)

p.thicken = 1
p.color = vec(1,1,1,1)

_.stage.lines.p = p
Yields:
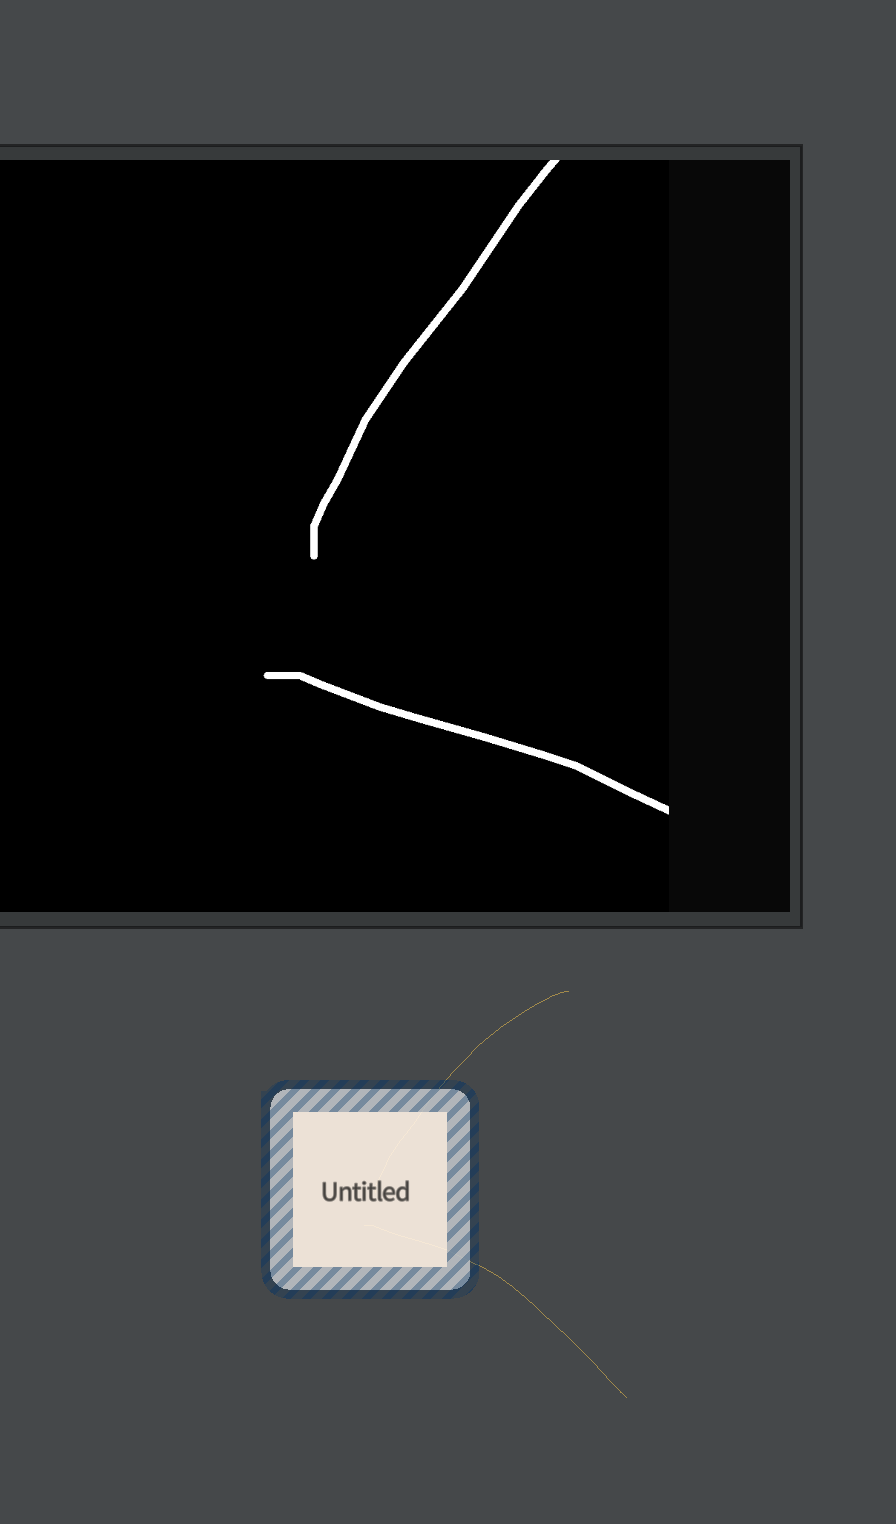
You need the - vec(_.frame.x, _.frame.y) and perhaps other manipulations to make sure that the line ends up actually on the Stage
Intersecting
If we wanted to implement a keyframe editor in Field, what are we missing?. We know how to draw curves, we know how to have a ‘tweakable’ line that gives us a lot of what we need to edit those curves, what else do we need? Obviously there are lots of menu items and toolbar buttons and the like, but that’s essentially uninteresting, unless we want to build and sell products. Let’s ask instead what is the fundamental connection between the curve and the code that we are missing? The key piece of code that we’re short of is to be able to read out where a curve intersects a vertical line. So we’ll add it:
First, let’s draw a curve:
var f = new FLine()
f.moveTo(0,0)
f.polarCubicTo(1,45, 1, 45, 100,100)
f.polarCubicTo(1,45, 1, 45, 200,200)
f.polarCubicTo(1,45, 1, -45, 500,100)
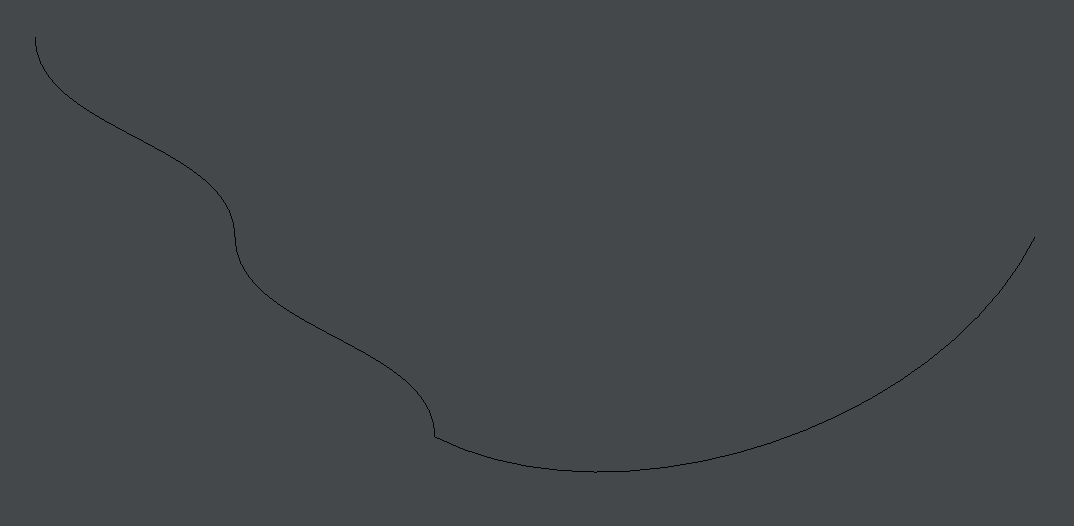
f.notation = true
_.lines.f = fThis yields, as you might expect, a curve:
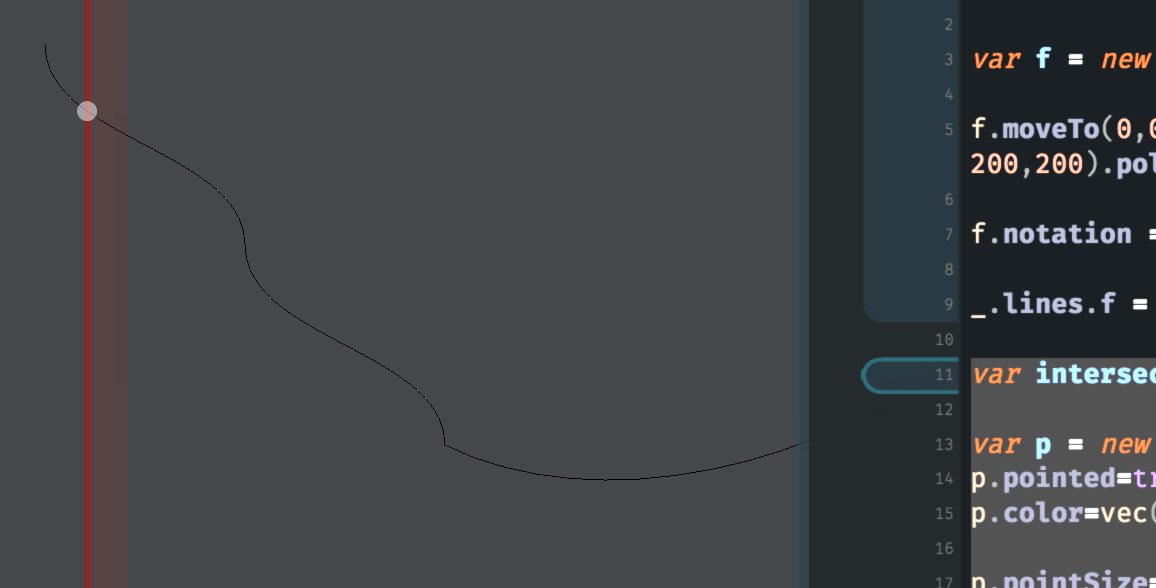
We’ve marked this line as f.notation = true. This allows us to write:
var intersections = _.intersectX(_.time.frame.x)The interesting call here is _.intersectX(_.time.frame.x). This figures out the intersection between a vertical line at _.time.frame.x and any line in this box that’s marked as .notation=true. (Remember that _.time.frame.x is the position of the ‘red line’ time marker). intersections ends up being a list of points that intersect this line. We’ll draw the points to prove that it’s working:
var p = new FLine()
p.pointed=true
p.color=vec(1,1,1,0.5)

p.pointSize=10
_.lines.q = p

for(var i of intersections)
{
	p.moveTo(i)
}
Yielding:
Incidentally, if we want Field to search over all boxes, and not just this box, to find possible intersections with .notation=true lines, we can write var intersections = __.intersectX( ... ) instead (note the __ rather than _ to refer to the whole worksheet).
Intersections works quite quickly, and can work on more complex geometries. Here’s a more complex sample that remains “notational”:
_.lines.clear()
var target = new FLine()
target.moveTo(0,0).polarCubicTo(1,45, 1, -45, 100,100).polarCubicTo(1,45, 1, 45, 200,200).polarCubicTo(1,45, 1, 45, 100,200)
for(var n=0;n<20;n++)
{
var f = new FLine()
f.moveTo(0,0).polarCubicTo(1,45, 1, 45, 100,100).polarCubicTo(1,45, 1, 45, 200,200).polarCubicTo(1,45, 1, -45, 200,100)
f.blendTowards(target, n/20)
f.notation = true
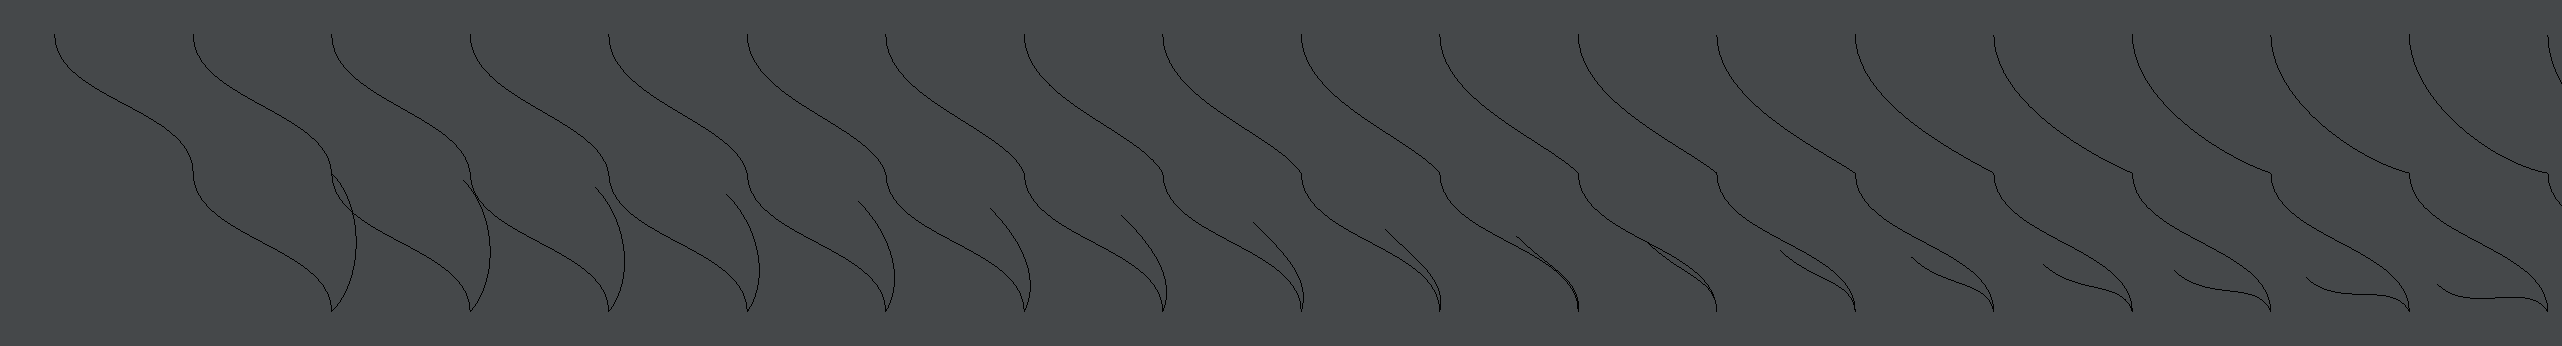
_.lines.add(f + vec(100*n, 0))
}Which makes this slowly evolving pattern:
We can then feed that into this:
while(true)
{
	var intersections = _.intersectX(_.time.frame.x)

	if (intersections.size()>0)
	{
		var p = new FLine().data("m*", intersections)
		p.pointed=true
		p.color=vec(1,1,1,0.5)

		p.pointSize=10
		_.lines.q = p
	}

	_.stage.lines.clear()
	for(var i=0;i<intersections.size();i++)
	{
		var x = -0.5+i/(intersections.size())

		var q = new FLine().rect(50+100*x, 50-intersections[i].y/5, 10, intersections[i].y/5*2)

		q.color=vec(1,1,1,1)
		q.filled=true
		_.stage.lines.add(q)
	}

	_.stage.frame()
}
Yielding a rhythmic, slowly evolving complex pattern:
Rather than adding a “feature” to Field (like a traditional keyframe editor) this is example an extension to Field which is multiplicative: all the knowledge that you have built up that concerns creation and control of geometry out of FLines can now be brought to bare on the problem of making drivers for animating that geometry, and vice versa — there’s nothing to stop you interrogating some moving geometry in this way in order to control an additional animation.